Why count shorebirds? A tale from Portugal

The Sado Estuary is one of Portugal’s most important wetlands – a key link in the chain of sites connecting Africa and the Arctic, on the East Atlantic Flyway. In a paper in Waterbirds, João Belo and colleagues analyse changes in numbers of waders wintering in this estuary over the period 2010 to 2019, with a focus on roost sites. These results are interpreted in regional and flyway contexts. The team find serious declines in numbers of Avocet, Dunlin and Ringed Plover.

Lost roost sites

The Sado Estuary became a nature reserve in 1980 and has since been classified as a Ramsar Site, a Special Protection Area (SPA – Natura 2000) and an Important Bird and Biodiversity Area. The Estuary lies about 30 km south of the much larger and more famous Tagus (or Tejo) Estuary, which is threatened by a new international airport (see Tagus Estuary: for birds or planes?). A suggestion that the Sado could provide mitigation habitat for damage done to the Tagus prompted scientists from the Universities of Aveiro and Lisbon to review the current state of the estuary.

João Belo and his colleagues used monthly data from a programme of wader surveys, conducted largely by volunteer birdwatchers. These took place between January 2010 and December 2019. Roosting birds were counted at high tide along the northern shores of the Sado estuary and any habitat changes were noted.

During the ten-year survey period, 21% of the available high-tide roost area was lost. These changes were associated with the commercial  abandonment of saltpans (with consequent increases in vegetation) and the conversion of others for fish farming (often with netting, to keep out fish-eating birds).

Results of the survey

In their paper, João Belo and colleagues focused on total numbers of waders and counts of the six most commonly-encountered species: Avocet, Dunlin, Black-tailed Godwit, Redshank, Ringed Plover and Grey Plover. They compared winter (Dec, Jan and Feb) counts in 2019 with those from 2010. This is when peak numbers of Avocet, Redshank and Grey Plover occur. Higher counts of Dunlin are made in spring, as schinzii birds returned from Africa, with peak counts of Black-tailed Godwit and Ringed Plover occurring in autumn.

The key findings are:

Ringed Plover numbers dropped by 23%
  • There was a strong decrease in the overall number of waders wintering in the Sado Estuary. This trend is mostly driven by steep declines in three of the six most abundant species: Avocet, Dunlin and Ringed Plover.
  • Avocet numbers were 42% lower in 2019 than they had been in 2010.
  • Dunlin numbers dropped by over half, with 2019 counts being only 47% of those in 2010. These are mostly dunlin of the alpina subspeciesthat breed between Northern Scandinavia and Siberia.
  • Ringed Plover numbers dropped by 23% between 2010 and 2019.
  • Redshank increased significantly between 2010 and 2019, while the population of Grey Plover was relatively stable, and it was not possible to derive a population trend for Black-tailed Godwit.

It is interesting to look at these patterns alongside data collected in Britain & Ireland, over the same period. As discussed in Do population estimates matter? and Ireland’s wintering waders, there have been major changes in wader numbers, with most species currently in decline.

At the same time that Avocet numbers have dropped on the Sado Estuary they have rocketed in the UK (here seen on the Humber Estuary)
  • Winter Avocet numbers have increased massively in Britain & Ireland. It is possible that young birds are more easily able to settle in these northern areas, now that winter temperatures are generally warmer. Declines in Portugal may reflect a northwards shift of the winter population, driven by new generations of birds.
  • Numbers of Ringed Plovers in Britain & Ireland did not change over the period 2010 to 2019 but had dropped a lot in the preceding twenty years.
  • For Dunlin, the size of the declines in Britain & Ireland are consistent with those on the Sado. It has been suggested that more young birds might be settling in areas such as the Wadden Sea, closer to Siberian breeding areas, something that may have become more possible given the reduced intensity and occurrence of freezing conditions along the east coast of the North Sea.

Regional and Flyway patterns

As discussed in the blog Interpreting changing wader counts, based on research led by Verónica Méndez, local changes in numbers are usually reflective of broader changes in population levels. Individual waders are unlikely to seek alternative wintering sites unless habitat is removed, so birds do not re-assort themselves into the ‘best’ areas when population levels decrease. Instead, there is general thinning out across all sites as populations decline. In this context, it is unsurprising that the trends in the Sado Estuary are similar to those found elsewhere in Portugal and in other Western European wintering areas.

Looking forwards

The survey data collected between 2010 and 2019 form a useful backdrop against which to monitor what might happen when (or perhaps if) a new international airport is constructed within the nearby Tagus Estuary. If some birds are displaced to the Sado, increases in numbers might be expected.

Displacement is not cost-free, as has been shown in a well-studied population of Redshanks on the Severn Estuary in Wales. When Cardiff Bay was permanently flooded, as part of a major redevelopment, colour-marked Redshank dispersed to sites up to 19 km away. Adult birds that moved to new sites had difficulty maintaining body condition in the first winter following the closure of Cardiff Bay, unlike the Redshank that were already living in these sites. Their survival rates in subsequent winters continued to be lower than for ‘local’ birds, indicating longer-term effects than might have been predicted.

These three papers are essential reading for anyone interested in the consequences of displacements caused by development projects.

Given that the Sado has multiple conservation designations, including as a Ramsar site, and that this study has shown a clear loss of available roosting areas, perhaps it is time to identify a high-tide refuge that can be fully protected and managed in ways which create a range of suitable habitats for use by long-legged and short-legged waders. A nature reserve such as this has a potential to attract birdwatchers too, with prospective increased income from tourism.

Sado International

Curlews don’t get a mention in this paper but the The Sado provides a neat link to a 2022 blog, A Norfolk Curlew’s Summer. This tale focuses on ‘Bowie’, a male Curlew that breeds in Breckland (Eastern England) and has been tracked to The Sado Estuary. In the blog, Bowie’s story stops in The Tagus but he subsequently headed further south to The Sado, where he spent the winter. At the time of writing (13 Feb 2023) he is still there but hopefully he will heading north soon.

The Sado is not only important in the winter, of course. As mentioned earlier, it is a spring stop-over for birds such as schinzii Dunlin, heading north from Africa to Siberia, and a moulting/staging site for waders heading south in late summer. Tracking and colour-ringing are telling more of these stories, with links to countries as far north as Canada and Siberia and as far south as South Africa.

The overgrown embankments within the former saltpans no longer provide suitable roosting sites for waders

Keep counting

The Sado story could not have been written without the work of volunteer counters who collect monthly data during the winter months, on the Sado Estuary, across Portugal and on the wider East Atlantic Flyway. These monitoring efforts are essential when attempting to track changes in wader populations, especially when extra information can indicate links to habitat changes, as is the case in the Sado. The international picture is painted using Flyway information generated using January counts that are developed by the Institute for Nature Conservation and Forests (ICNF).

Here is a link to the paper:

Synchronous declines of wintering waders and high-tide roost area in a temperate estuary: results of a 10-year monitoring programme. João R. Belo, Maria P. Dias, João Jara, Amélia Almeida, Frederico Morais, Carlos Silva, Joaquim Valadeiro & José A. Alves. Waterbirds. doi.org/10.1675/063.045.0204

Birdwatchers that volunteered to survey roost-sites gather for a team photo

WaderTales blogs are written by Graham Appleton (@GrahamFAppleton) to celebrate waders and wader research. Many of the articles are based on published papers, with the aim of making shorebird science available to a broader audience.

UK waders: “Into the Red”

If you ask British birdwatchers to name the eleven wader species that are causing the most conservation concern in the UK, they would probably not include Dunlin. Curlew may well be top of their lists, even though the most recent population estimate is 58,500 breeding pairs, but would people remember to include Ruff?

This blog is a new incarnation of Nine Red-listed UK Waders, explaining why there are now eleven shorebird species on the UK Red List. Its publication coincides with the appearance of the BTO book Into the Red which highlights the problems being faced by seventy species that breed and/or spend the winter in the United Kingdom. The work of seventy writers and seventy artists has been curated by Kit Jewitt (@YOLOBirder on Twitter) and Mike Toms (BTO), and the book is being sold to support the work of both the BTO and the Rare Breeding Birds Panel.

What’s a Red List?

The UK Red List is made up of a strange mixture of common and rare species. Nobody will be surprised to see fast-disappearing Turtle Dove and Willow Tit, but why are 5.3 million pairs of House Sparrow (right) in the same company?

The list is very important because it helps to set the agenda for conservation action, influences the way that money for research is distributed and focuses attention during planning decisions. The main criteria for inclusion are population size – hence the inclusion of species that are just hanging on in the UK, such as Turtle Dove – and the speed of decline of common species. Data collected by volunteers, working under the auspices of the British Trust for Ornithology (BTO), measured a population decline for House Sparrow of 69% between 1977 and 2018, which is worrying enough to earn this third most numerous breeding species in the UK a place in Into the Red.

Mark Eaton of the Rare Breeding Birds Panel explains how listing works.

The Birds of Conservation Concern (BOCC) system, through which the Red List and Amber Lists are determined, uses a strict set of quantitative criteria to examine the status of all of the UK’s ‘regularly’ occurring species (scarce migrants and vagrants aren’t considered), and uses a simple traffic light system to classify them. There are ‘Red’ criteria with thresholds for rates of decline in numbers and range, historical decline and international threat (if a species is considered globally threatened it is automatically Red-listed in the UK), together with a range of other considerations such as rarity, the international importance of UK populations, and how localised a species is. If a species meets any of the Red List criteria it goes onto the Red List.

This blog is about the eleven waders in Into the Red, but there are 59 other fascinating species accounts and wonderful artworks. Each of the species accounts below starts with a quote from the book and is accompanied by a low-resolution version of the artwork.

Dotterel

“Dot, dot, dot, Dotterel. Disappearing – a dash, dashing off the page.” – Alicia Hayden

The UK’s small population of Dotterel is restricted to the high tops of Scottish mountains, with only occasional breeding reports elsewhere. Three decades ago, the warning bells were raised, as warming conditions and an elevated snowline turned the Dotterel into a poster bird for climate change campaigners. The detailed reasons for the species’ decline may still need to be nailed down but candidate causes, such as declining insect food supplies and the increasing numbers of generalist predators, are probably all linked to a changing climate – squeezing Dotterel into a smaller area of the mountain plateaux of Scotland.

There’s a blog about the decline in Dotterel numbers called UK Dotterel numbers have fallen by 57%, based upon a paper that uses data up until 2011. At this point, the population was estimated at between 280 and 645 pairs. There has been no suggestion of improvement since that blog was written. Interestingly, Dotterel may have a way out of their predicament, as we know that marked individuals move between Scotland and Norway in the same breeding season. See also Scotland’s Dotterel: still hanging on, which highlights the pressures that youngsters face in North Africa, during the first eighteen months of their lives.
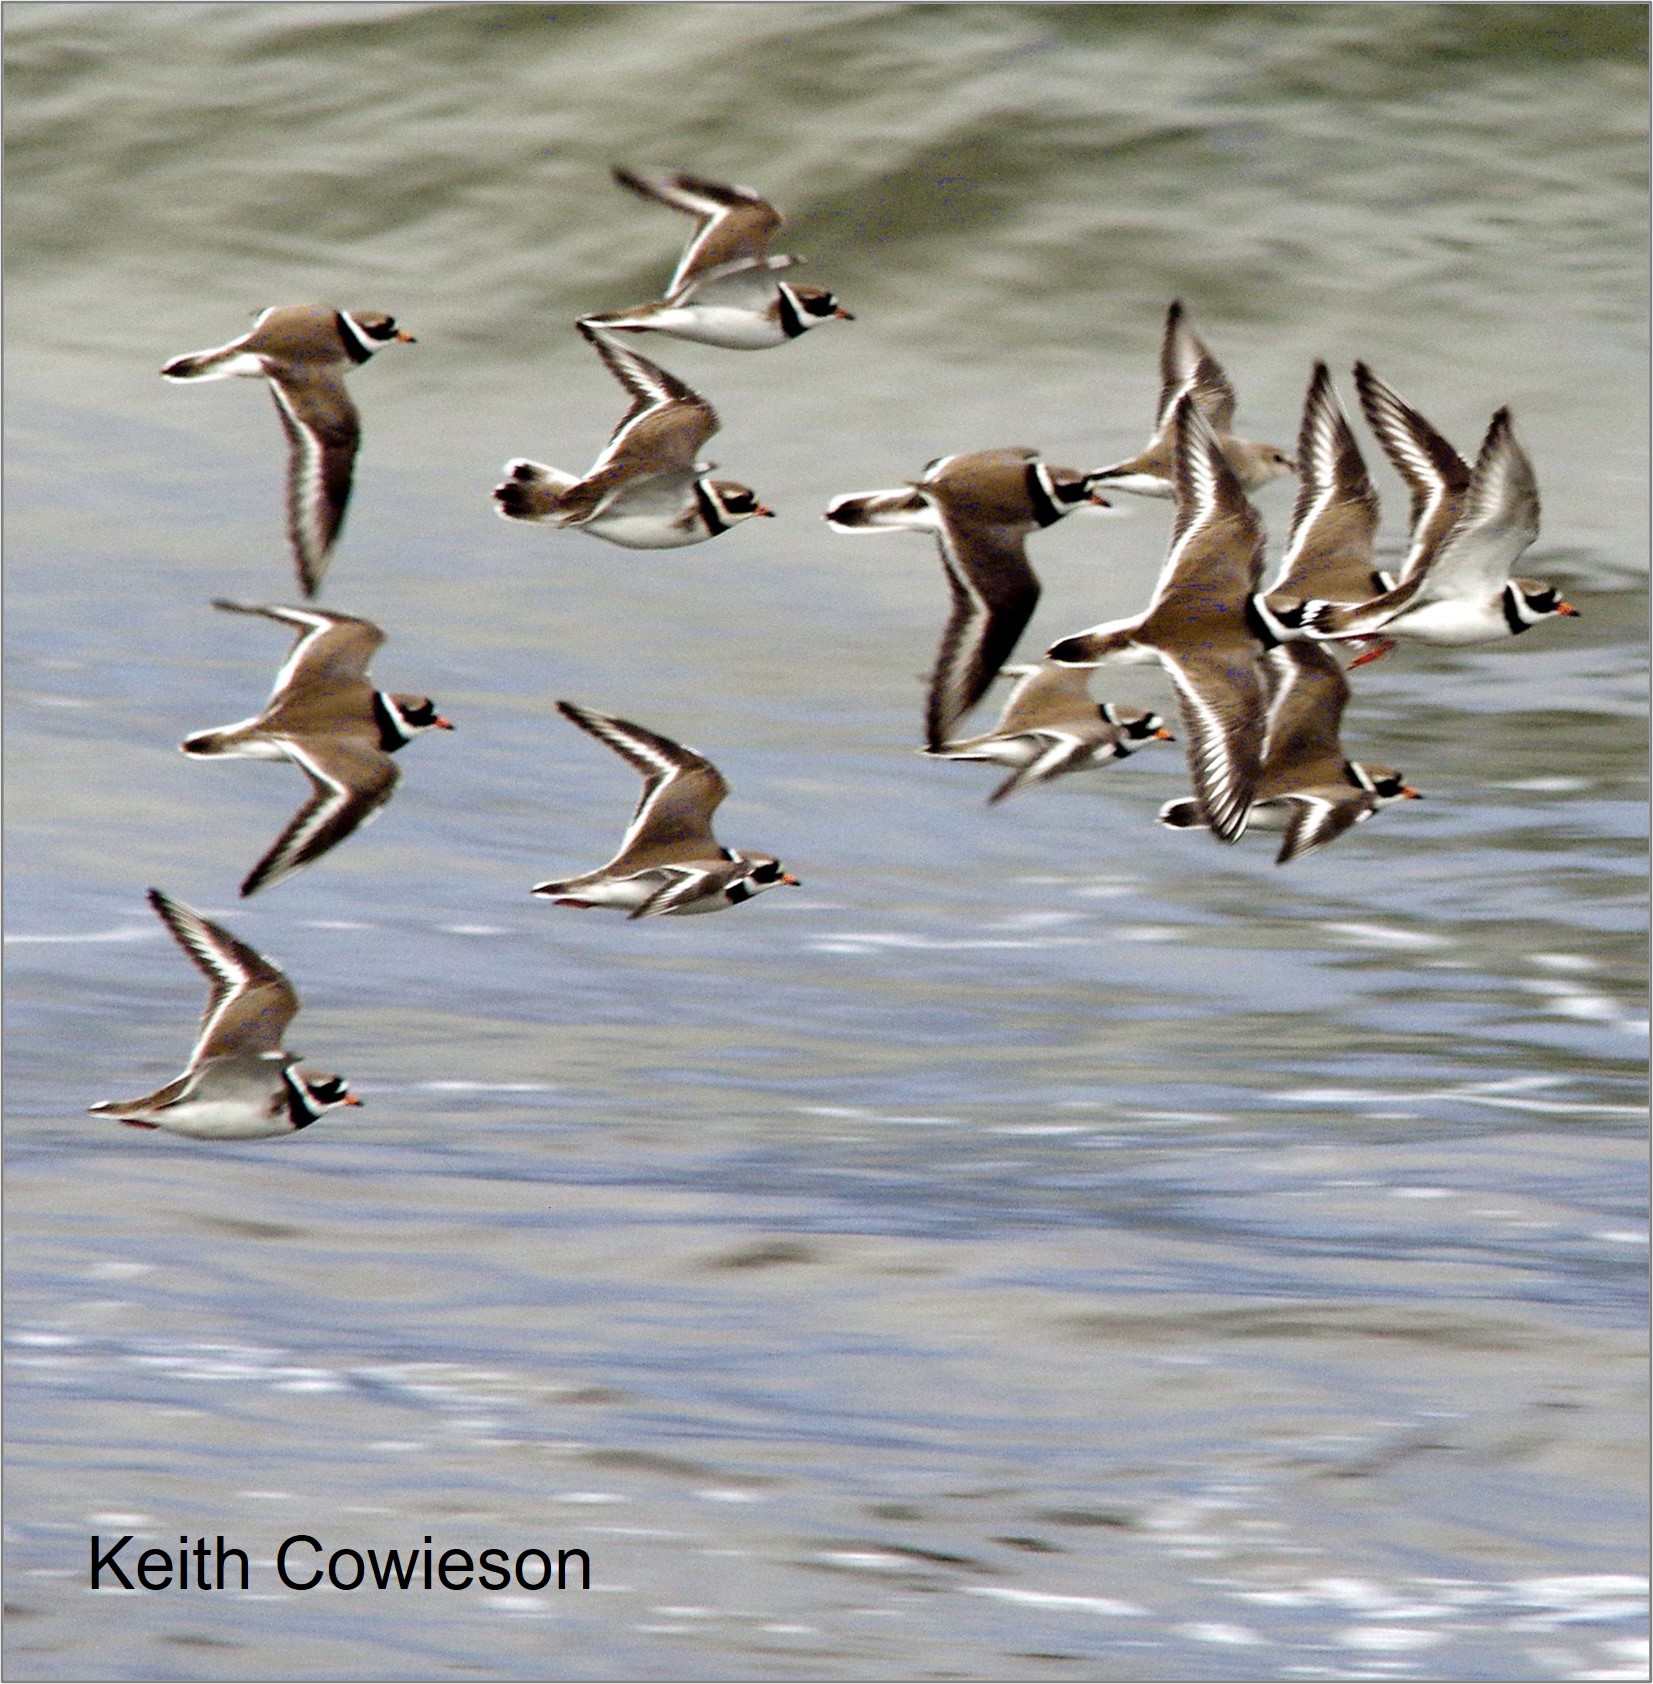
Ringed Plover

“The gentle scuttle over the rocks, the unmistakable bum-bob and the elegant glide into a nest site– Dan Rouse

One of the criteria that the BOCC panel takes into account, when constructing the Red List, is the responsibility the UK has for a species or subspecies in the breeding season, during winter or both. The Ringed Plovers we see in the UK in the winter are almost exclusively of the hiaticula subspecies; birds that breed in southern Scandinavia, around the Baltic, in western Europe and in the UK. There are only estimated to be 73,000 individuals in this subspecies, so the 42,500 that winter in the UK constitute a large percentage of the Ringed Plovers that breed in many of these countries.

The Wetland Bird Survey graph shows a decline of over 50% between 1989 and 2014. At the start of the period, Ringed Plover numbers were at an all-time high but this is still a dramatic and consistent drop. Numbers on the open coast did not drop as much (see Waders on the coast) and those on estuaries may have stabilised or even have increased slightly, since 2014, but Ringed Plovers need some good breeding years. Disturbance is an issue for nesting Ringed Plovers, which share their beaches with visitors and dogs, as discussed in this blog about the ‘no go’ areas along the Norfolk and Suffolk coasts – On the beach. Winter disturbance can be a problem for waders too (see Disturbed Turnstones).

Lapwing

“I heard them before I saw them. Like the plaintive squeak of a rubber toy, or an oboist tuning up …” – Tessa Boase

The Lapwing used to nest across the whole of the United Kingdom and was a common bird in almost every village. It’s still the most numerous breeding wader in the UK, with 97,500 pairs (APEP4), beating Oystercatcher by just 2,000 pairs. Numbers dropped by 55% between 1967 and 2018, according to BirdTrends 2020, published by BTO & JNCC. Huge losses had already occurred over the previous two centuries, as land was drained and vast numbers of eggs were collected for the table. The Lapwing is now a bird associated with lowland wet grasslands and the uplands, rather than general farmland.

Red-listing has been important for Lapwing, increasing the profile of the species and encouraging the development of specific agri-environment schemes targeted at species recovery. These include ‘Lapwing plots’ in arable fields and funding to raise the summer water tables in lowland grassland. Several WaderTales blogs describe efforts to try to increase the number of breeding waders in wet grassland, especially Toolkit for Wader Conservation. The loss of waders, and Lapwings in particular, from general farmland is exemplified in 25 years of wader declines. There are many predators that line up to take Lapwing eggs so it pays to nest in loose ‘colonies’, so that guard duties can be shared.
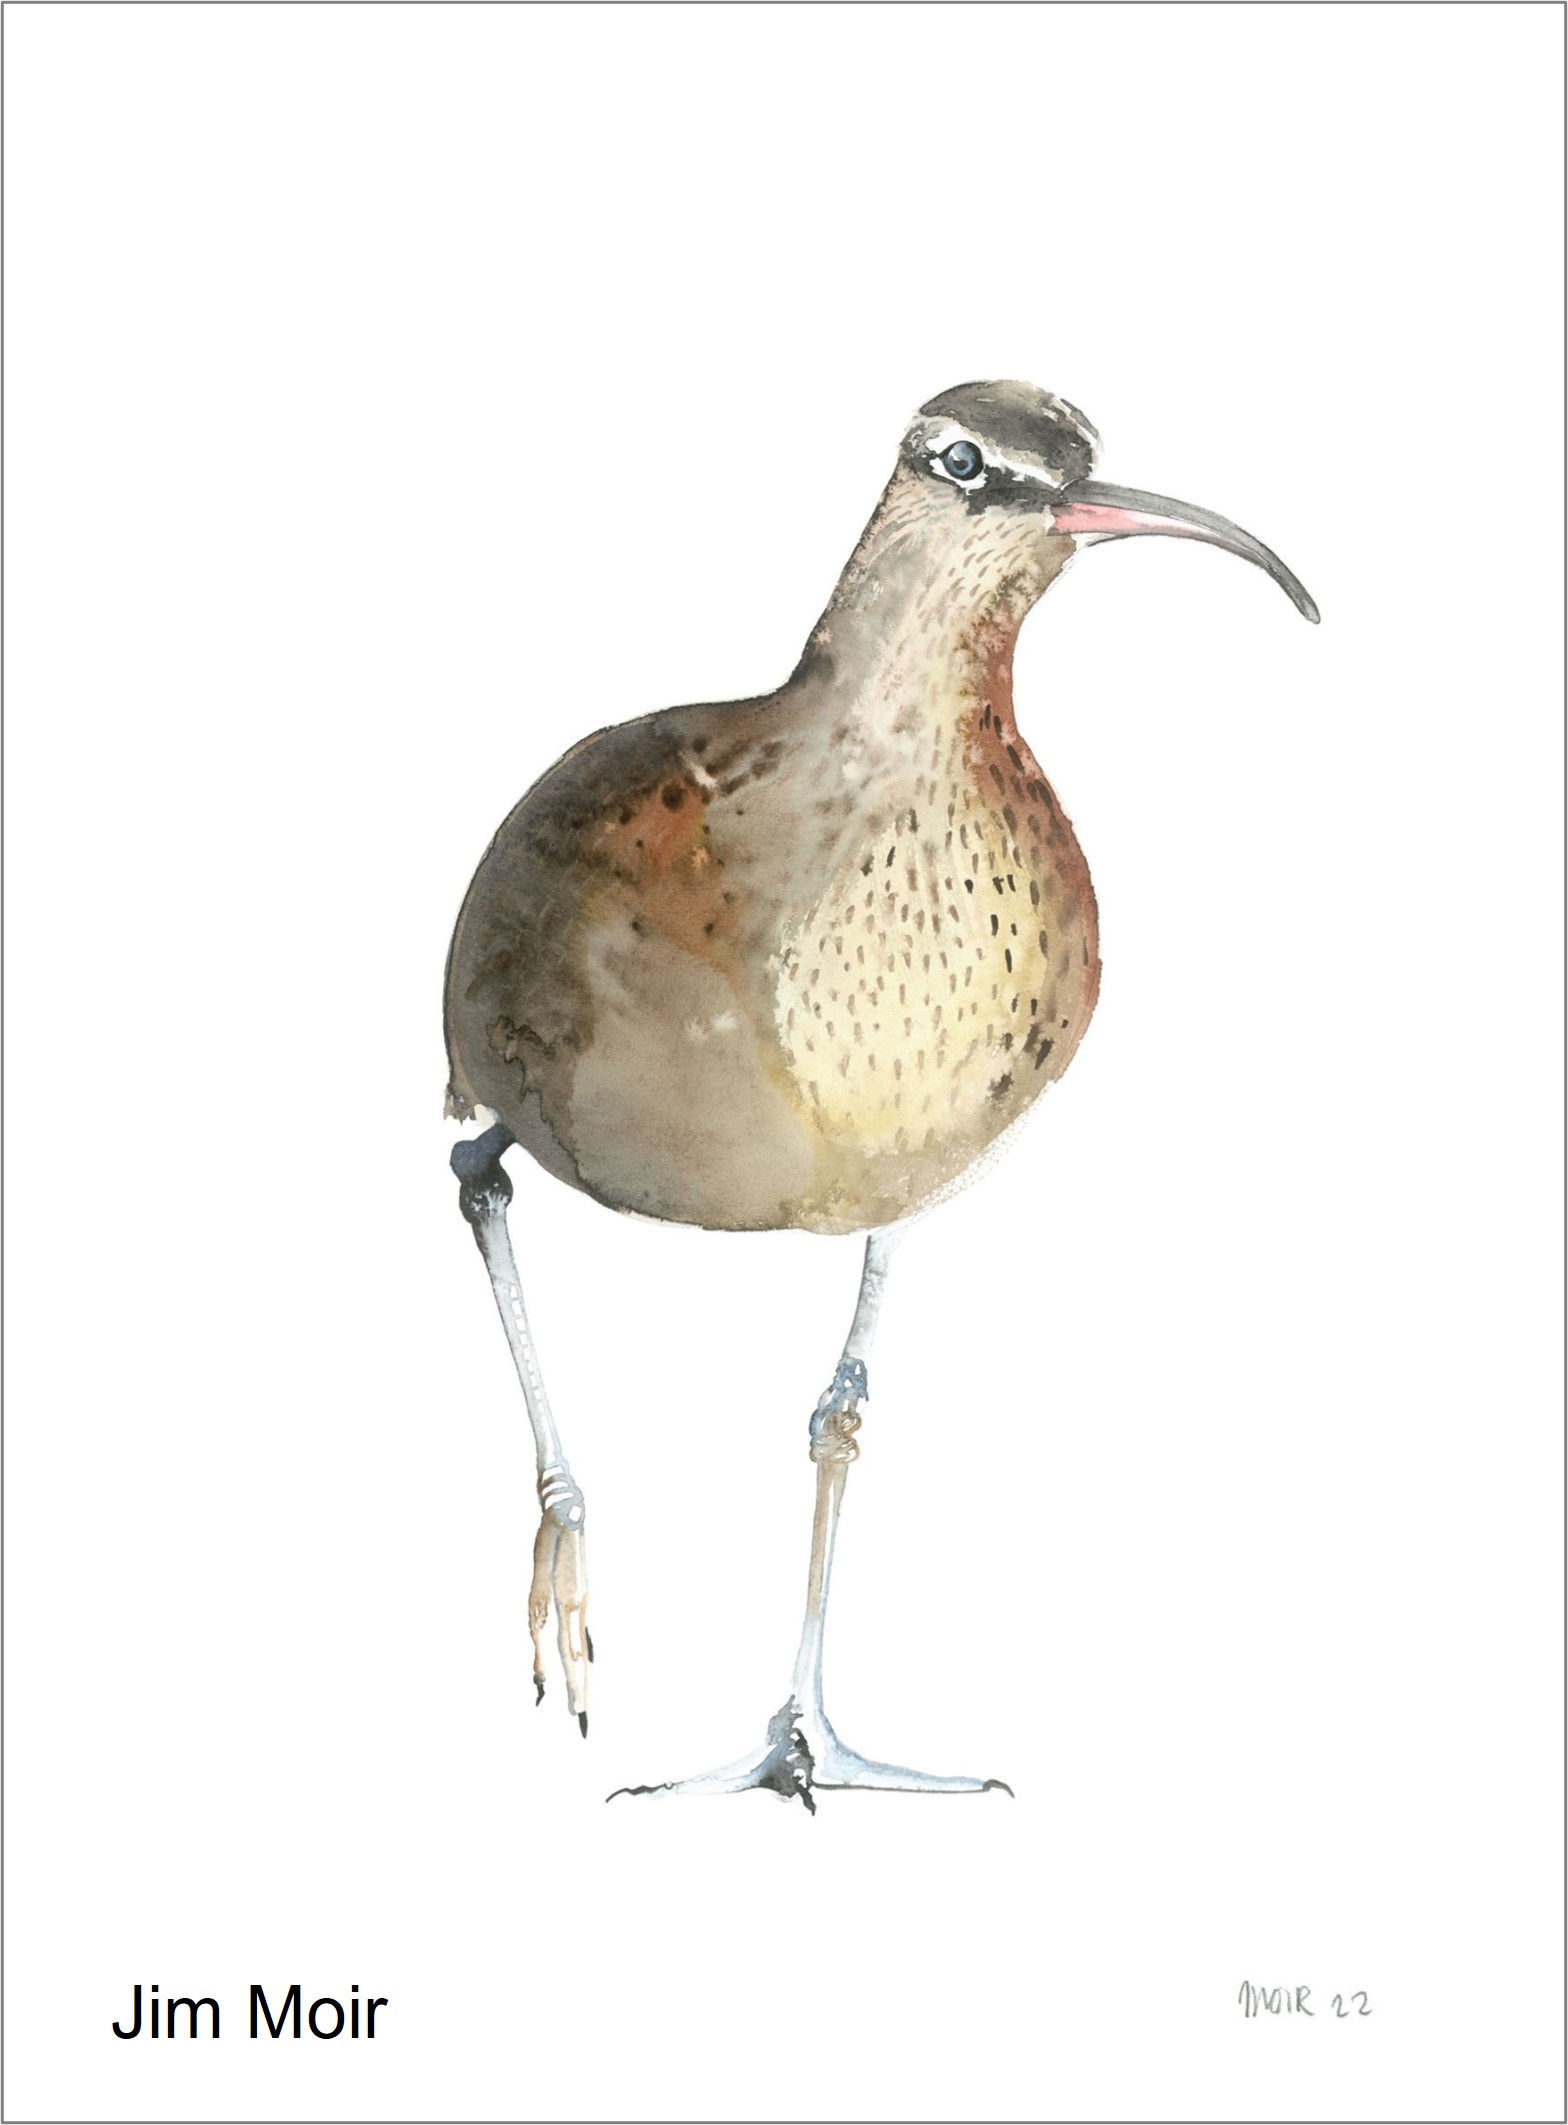
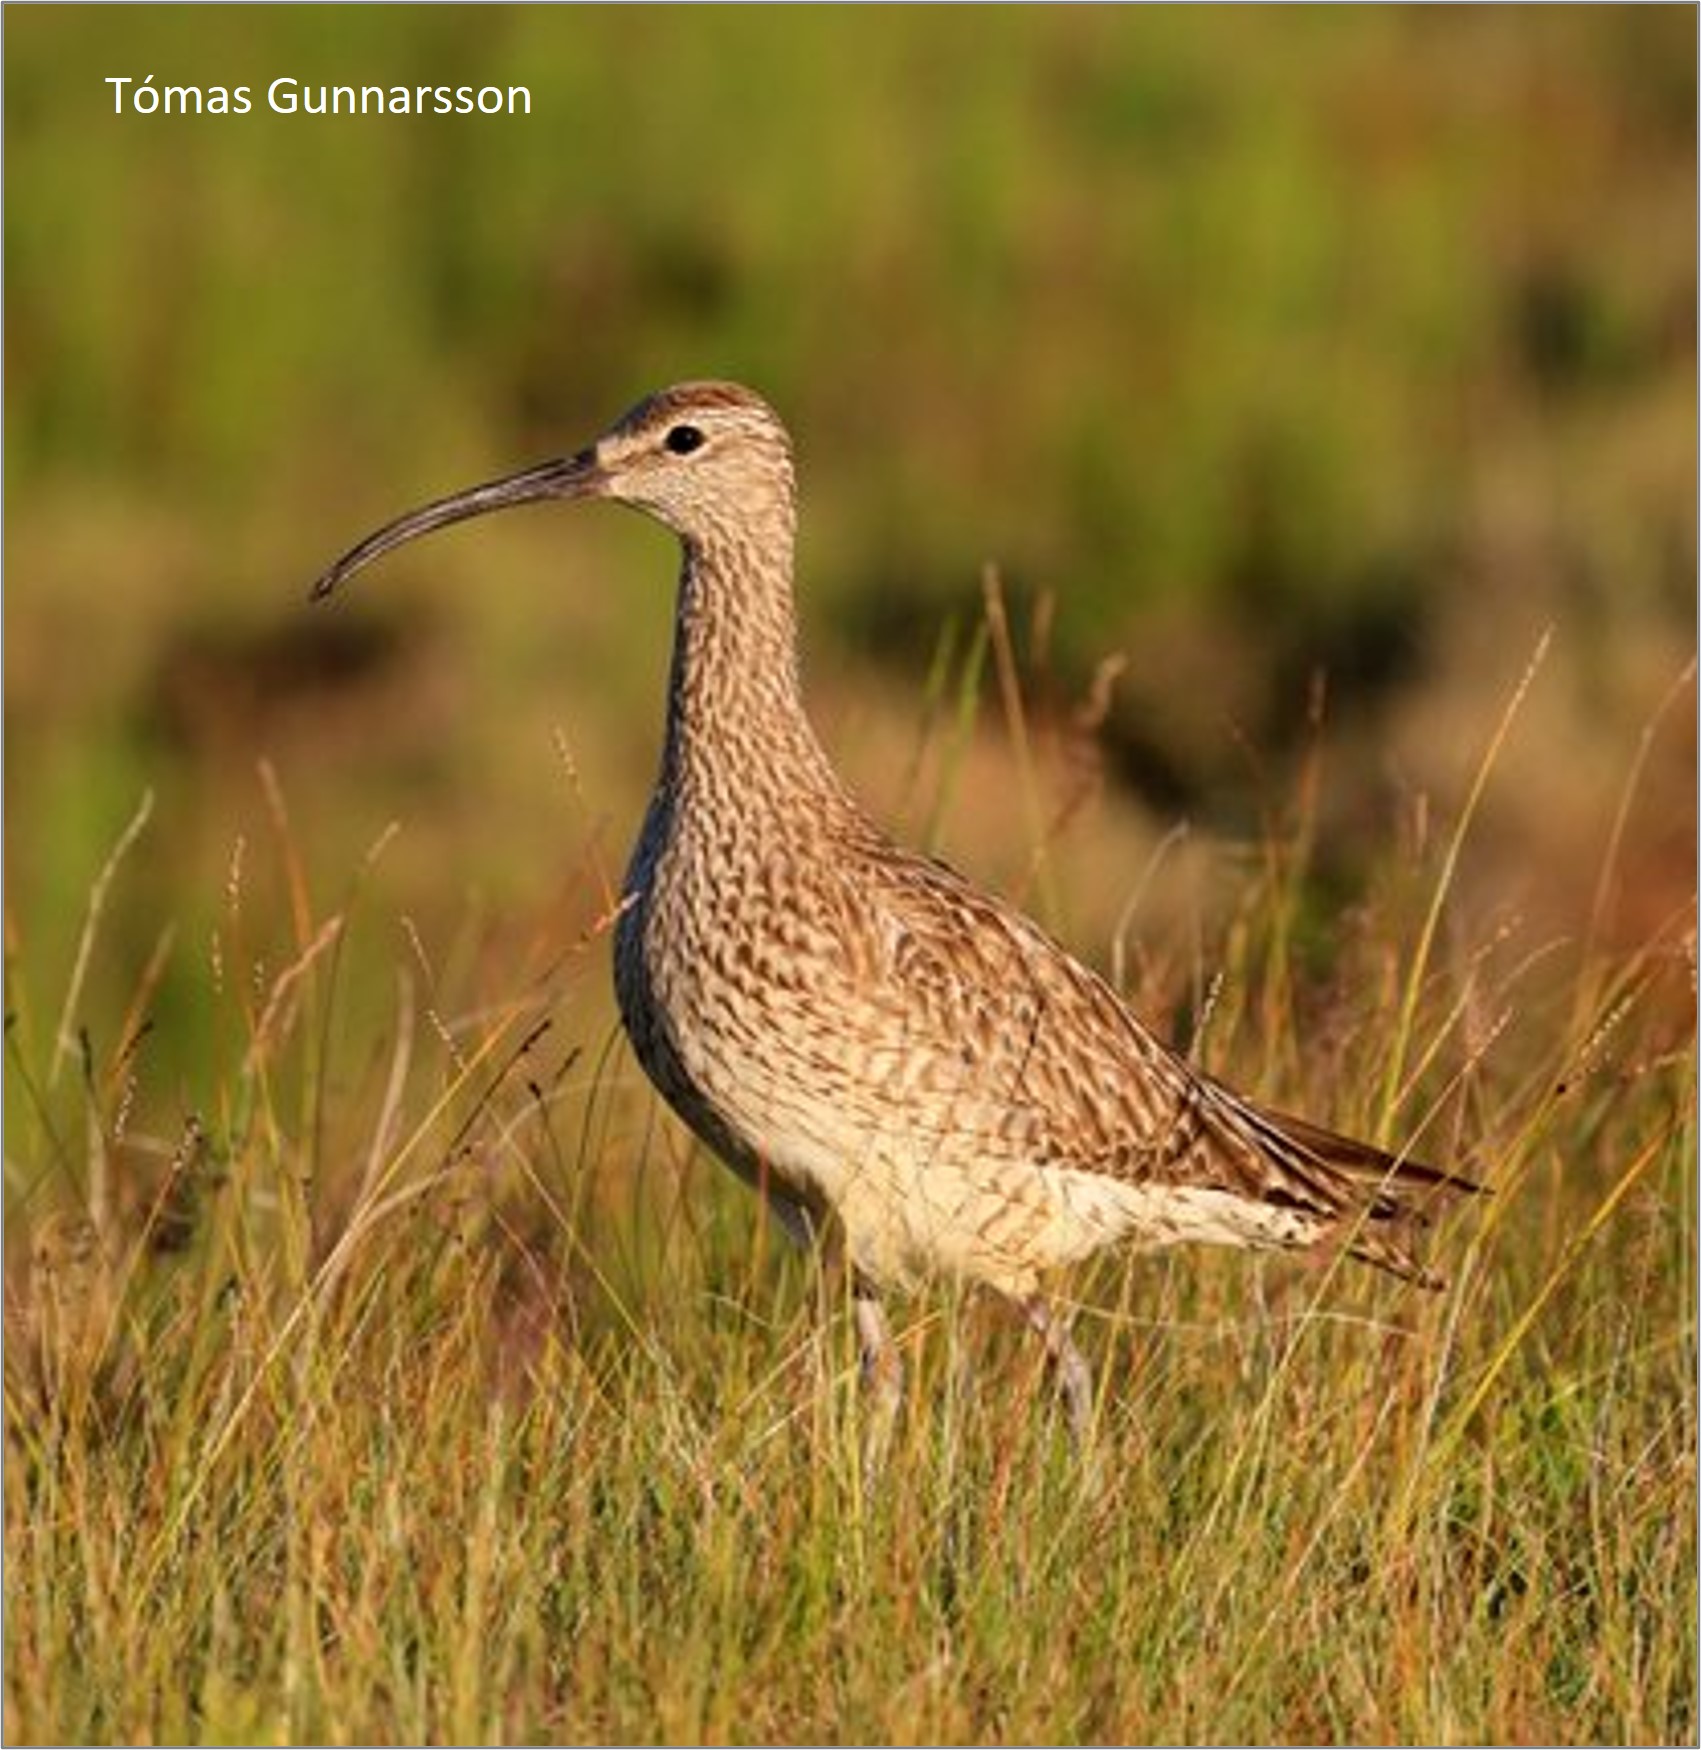
Whimbrel

“Whimbrel have been doing this journey, between tundra and heath of northern Europe to mudflats and mangroves of Africa, for at least 1.9 million years – Rosie Ellis

Most British and Irish birdwatchers think of Whimbrel as spring migrants, enjoying seeing flocks of Icelandic birds when they pause on their way north from West Africa (see Iceland to Africa non-stop). There is a small, vulnerable UK population nesting almost exclusively on Shetland. The latest estimate is 290 pairs (2009), down from an estimate of 530 pairs, published in 1997. We await the results of a 2021 survey with interest. Many pairs have been lost from Unst and Fetlar and this blog about habitat requirements might give clues as to why: Establishing breeding requirements of Whimbrel.

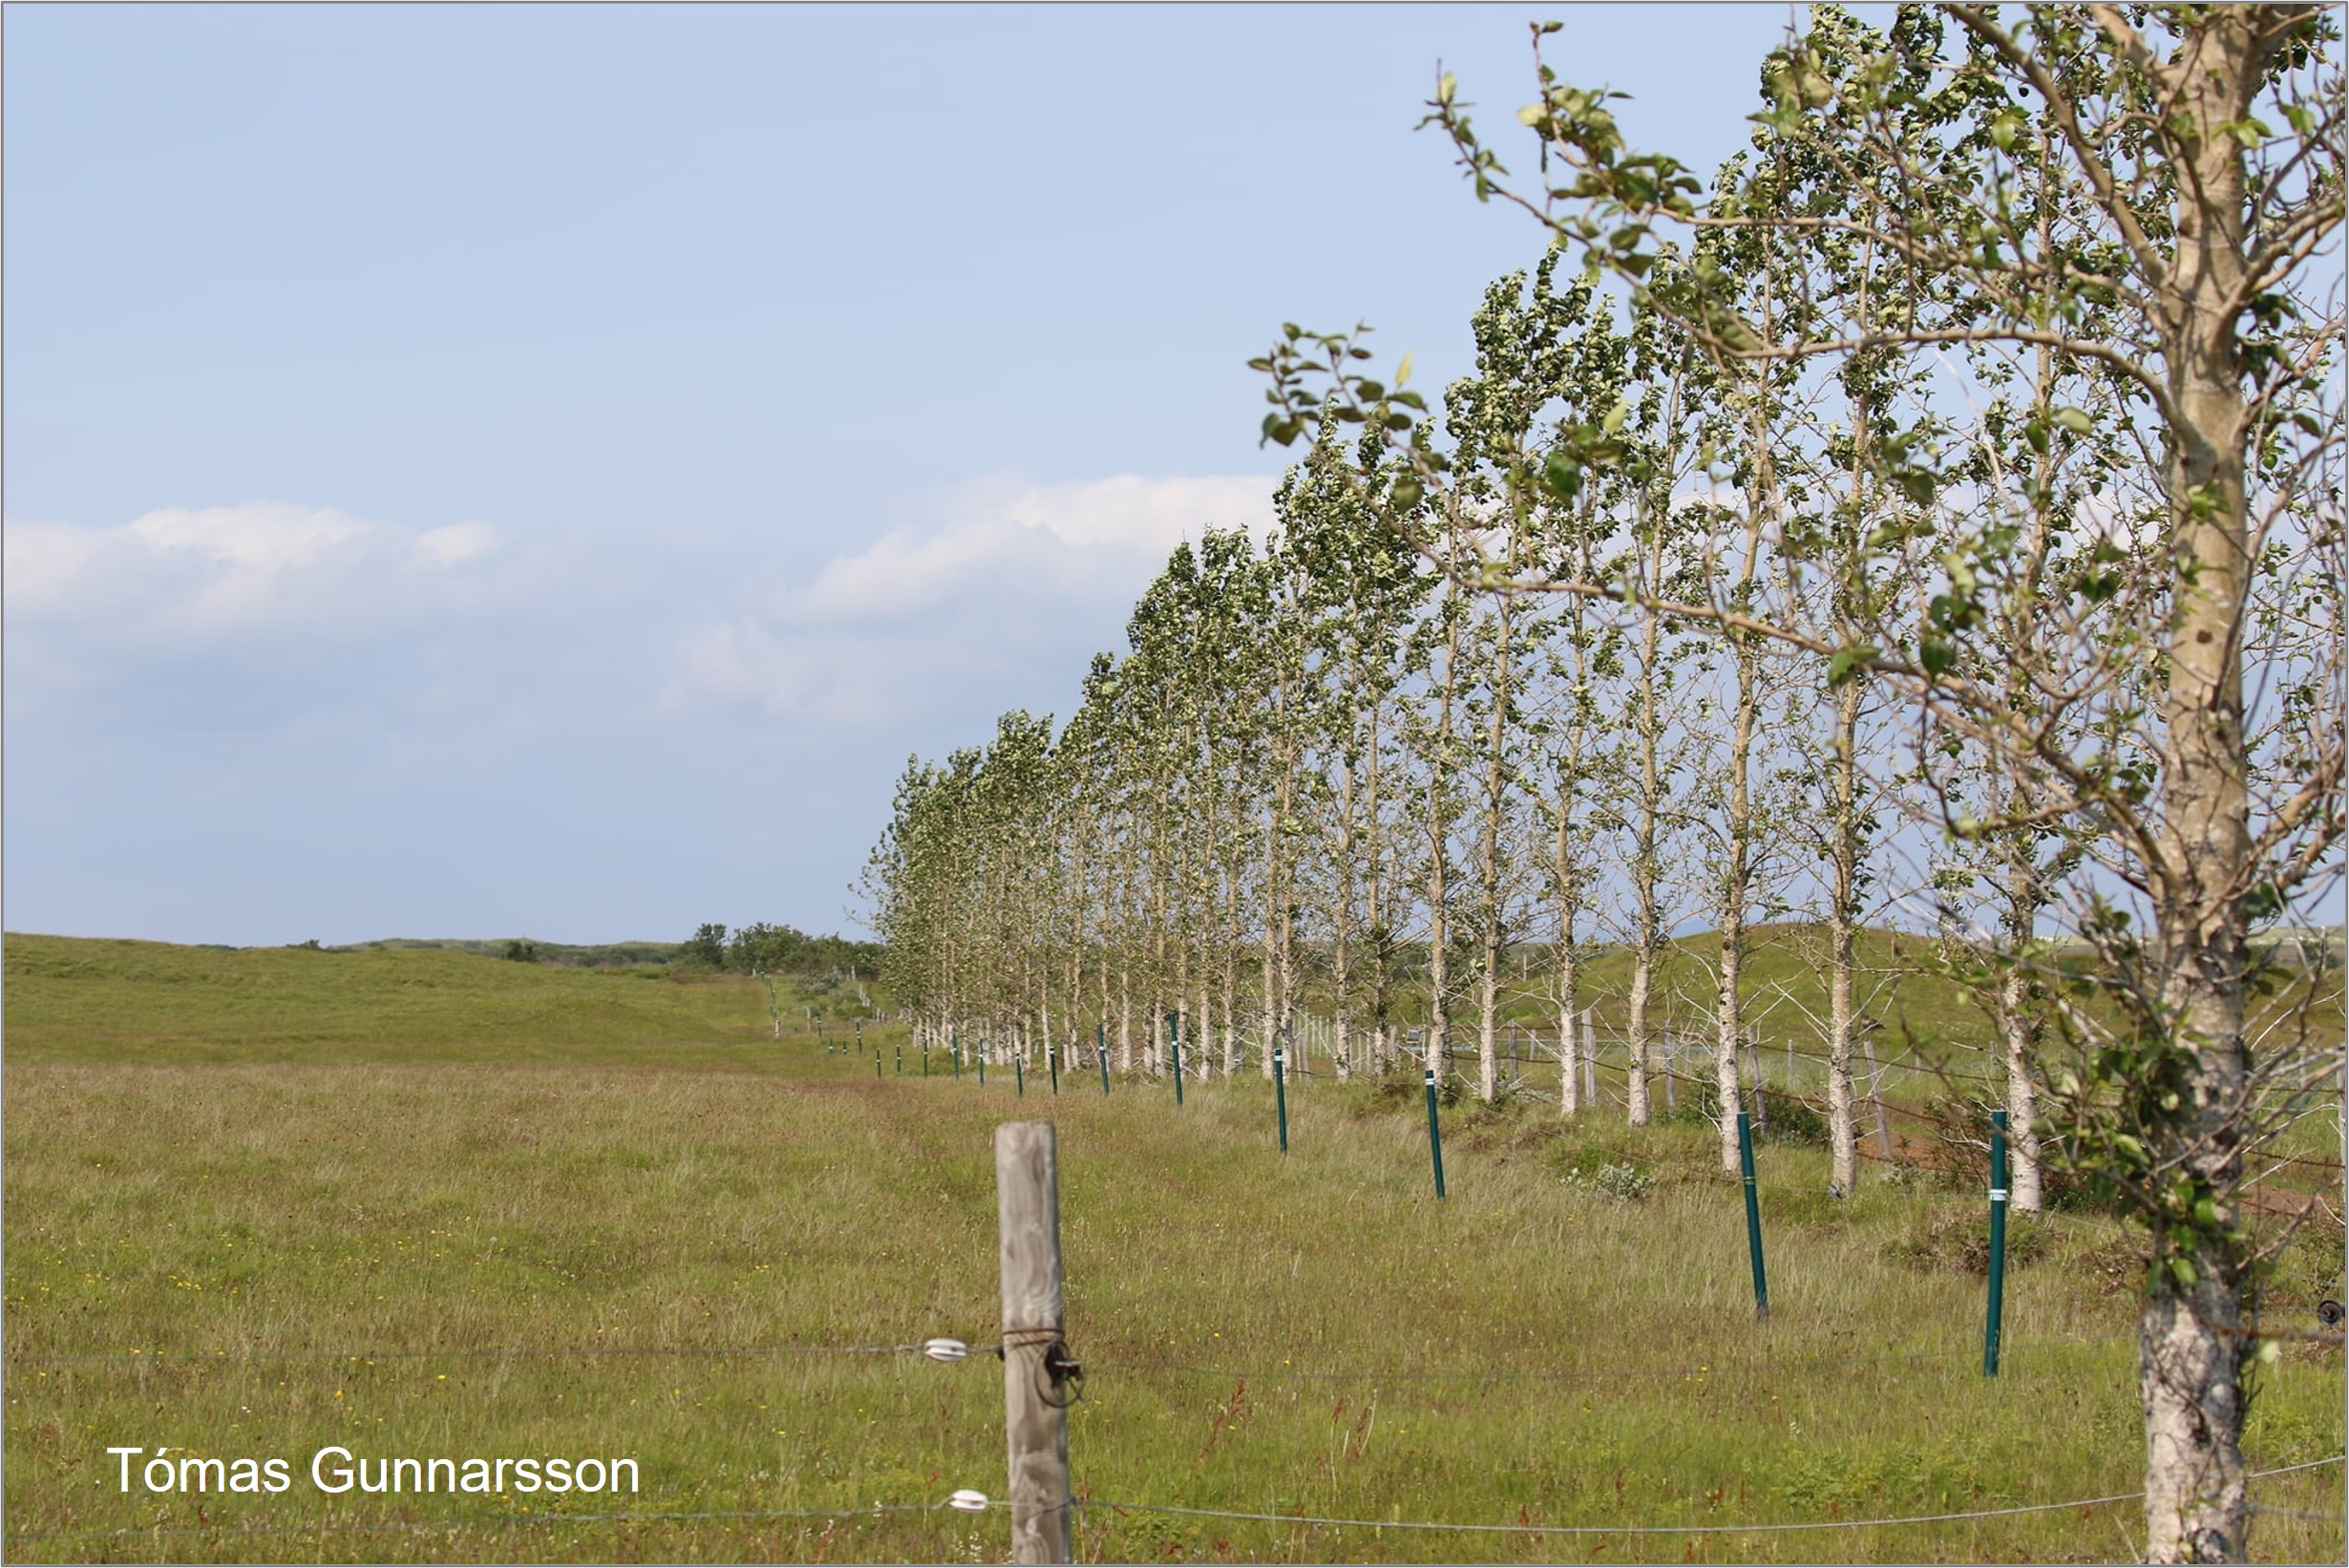
The curlew family is in trouble across the Globe, potentially because these big birds need so much space (see Why are we losing our large waders?). Hints of future issues for Eurasian Whimbrel are coming from Iceland, where forestry is squeezing them out of some key areas: Iceland’s waders need a strategic forestry plan.
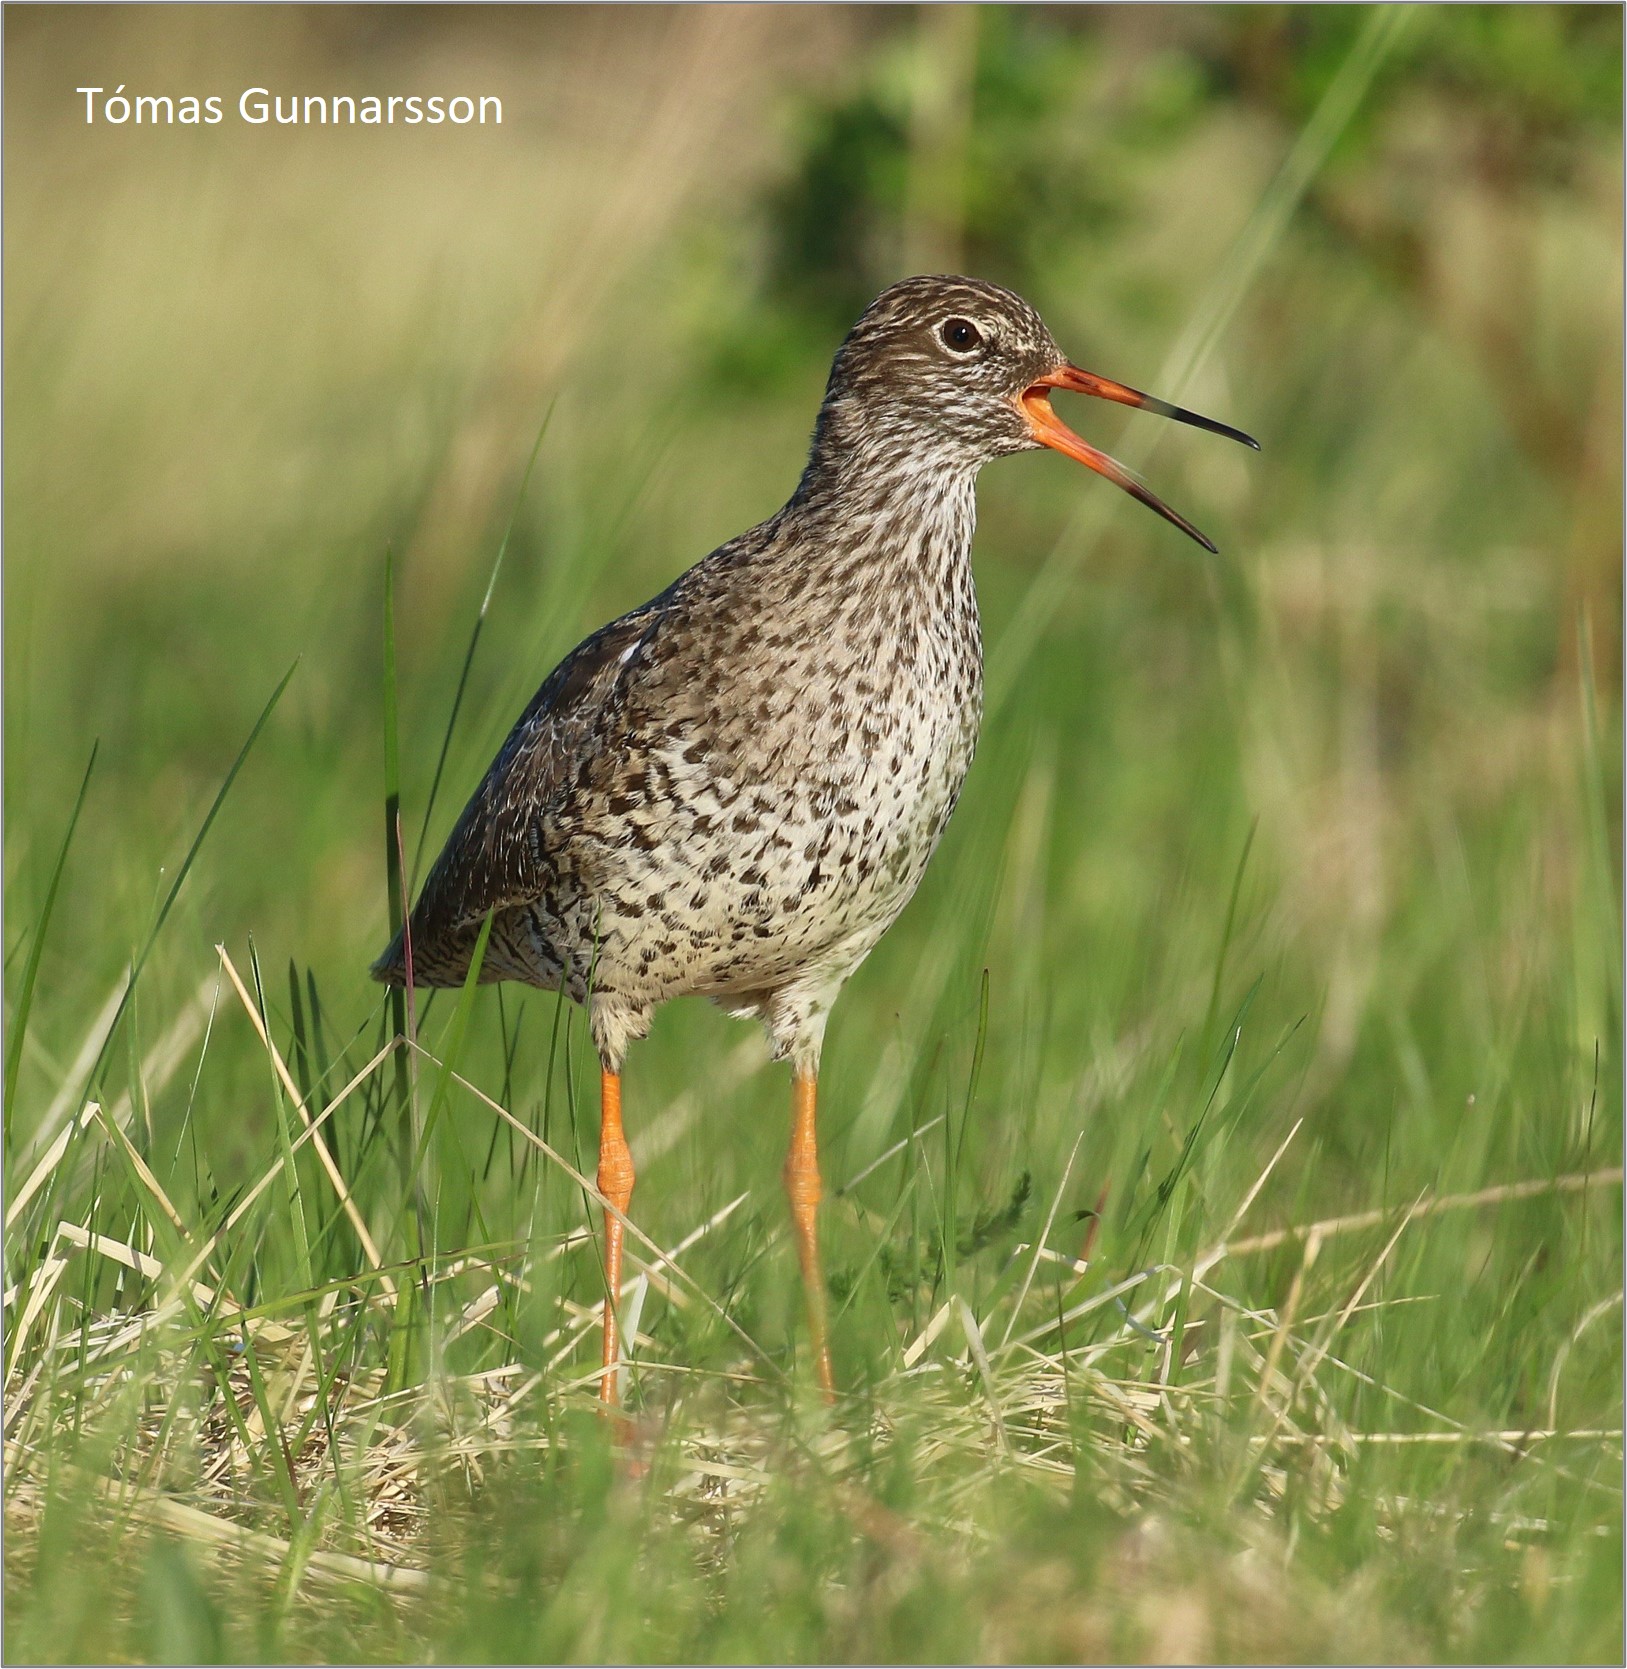
Curlew

“A song that seems to split in mid-air and take the heart in two directions at once – David Gray

What more can be said about Curlew, ‘promoted’ to the red list in 2015 and designated as ‘near threatened’ globally. Most significant is the story from Ireland, where 94% of breeding birds disappeared in just 30 years. These blogs provide more information about the decline and review some of the reasons.

Across every part of the UK, stakeholder groups have come together to support populations of breeding Curlew, using a mixture of habitat management, predator reduction and nest protection measures. One recent innovation is to raise chicks in captivity, in an attempt to boost local populations in England. There’s more in Will head-starting work for Curlew?
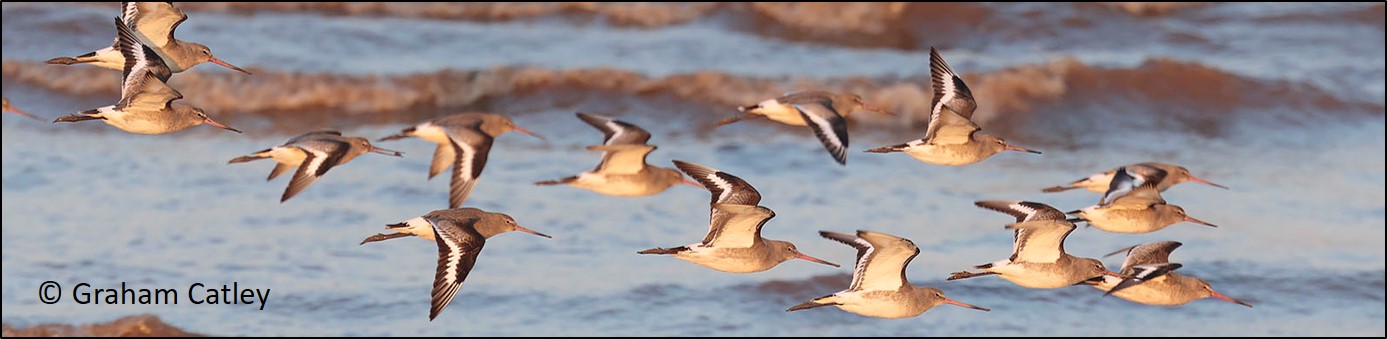
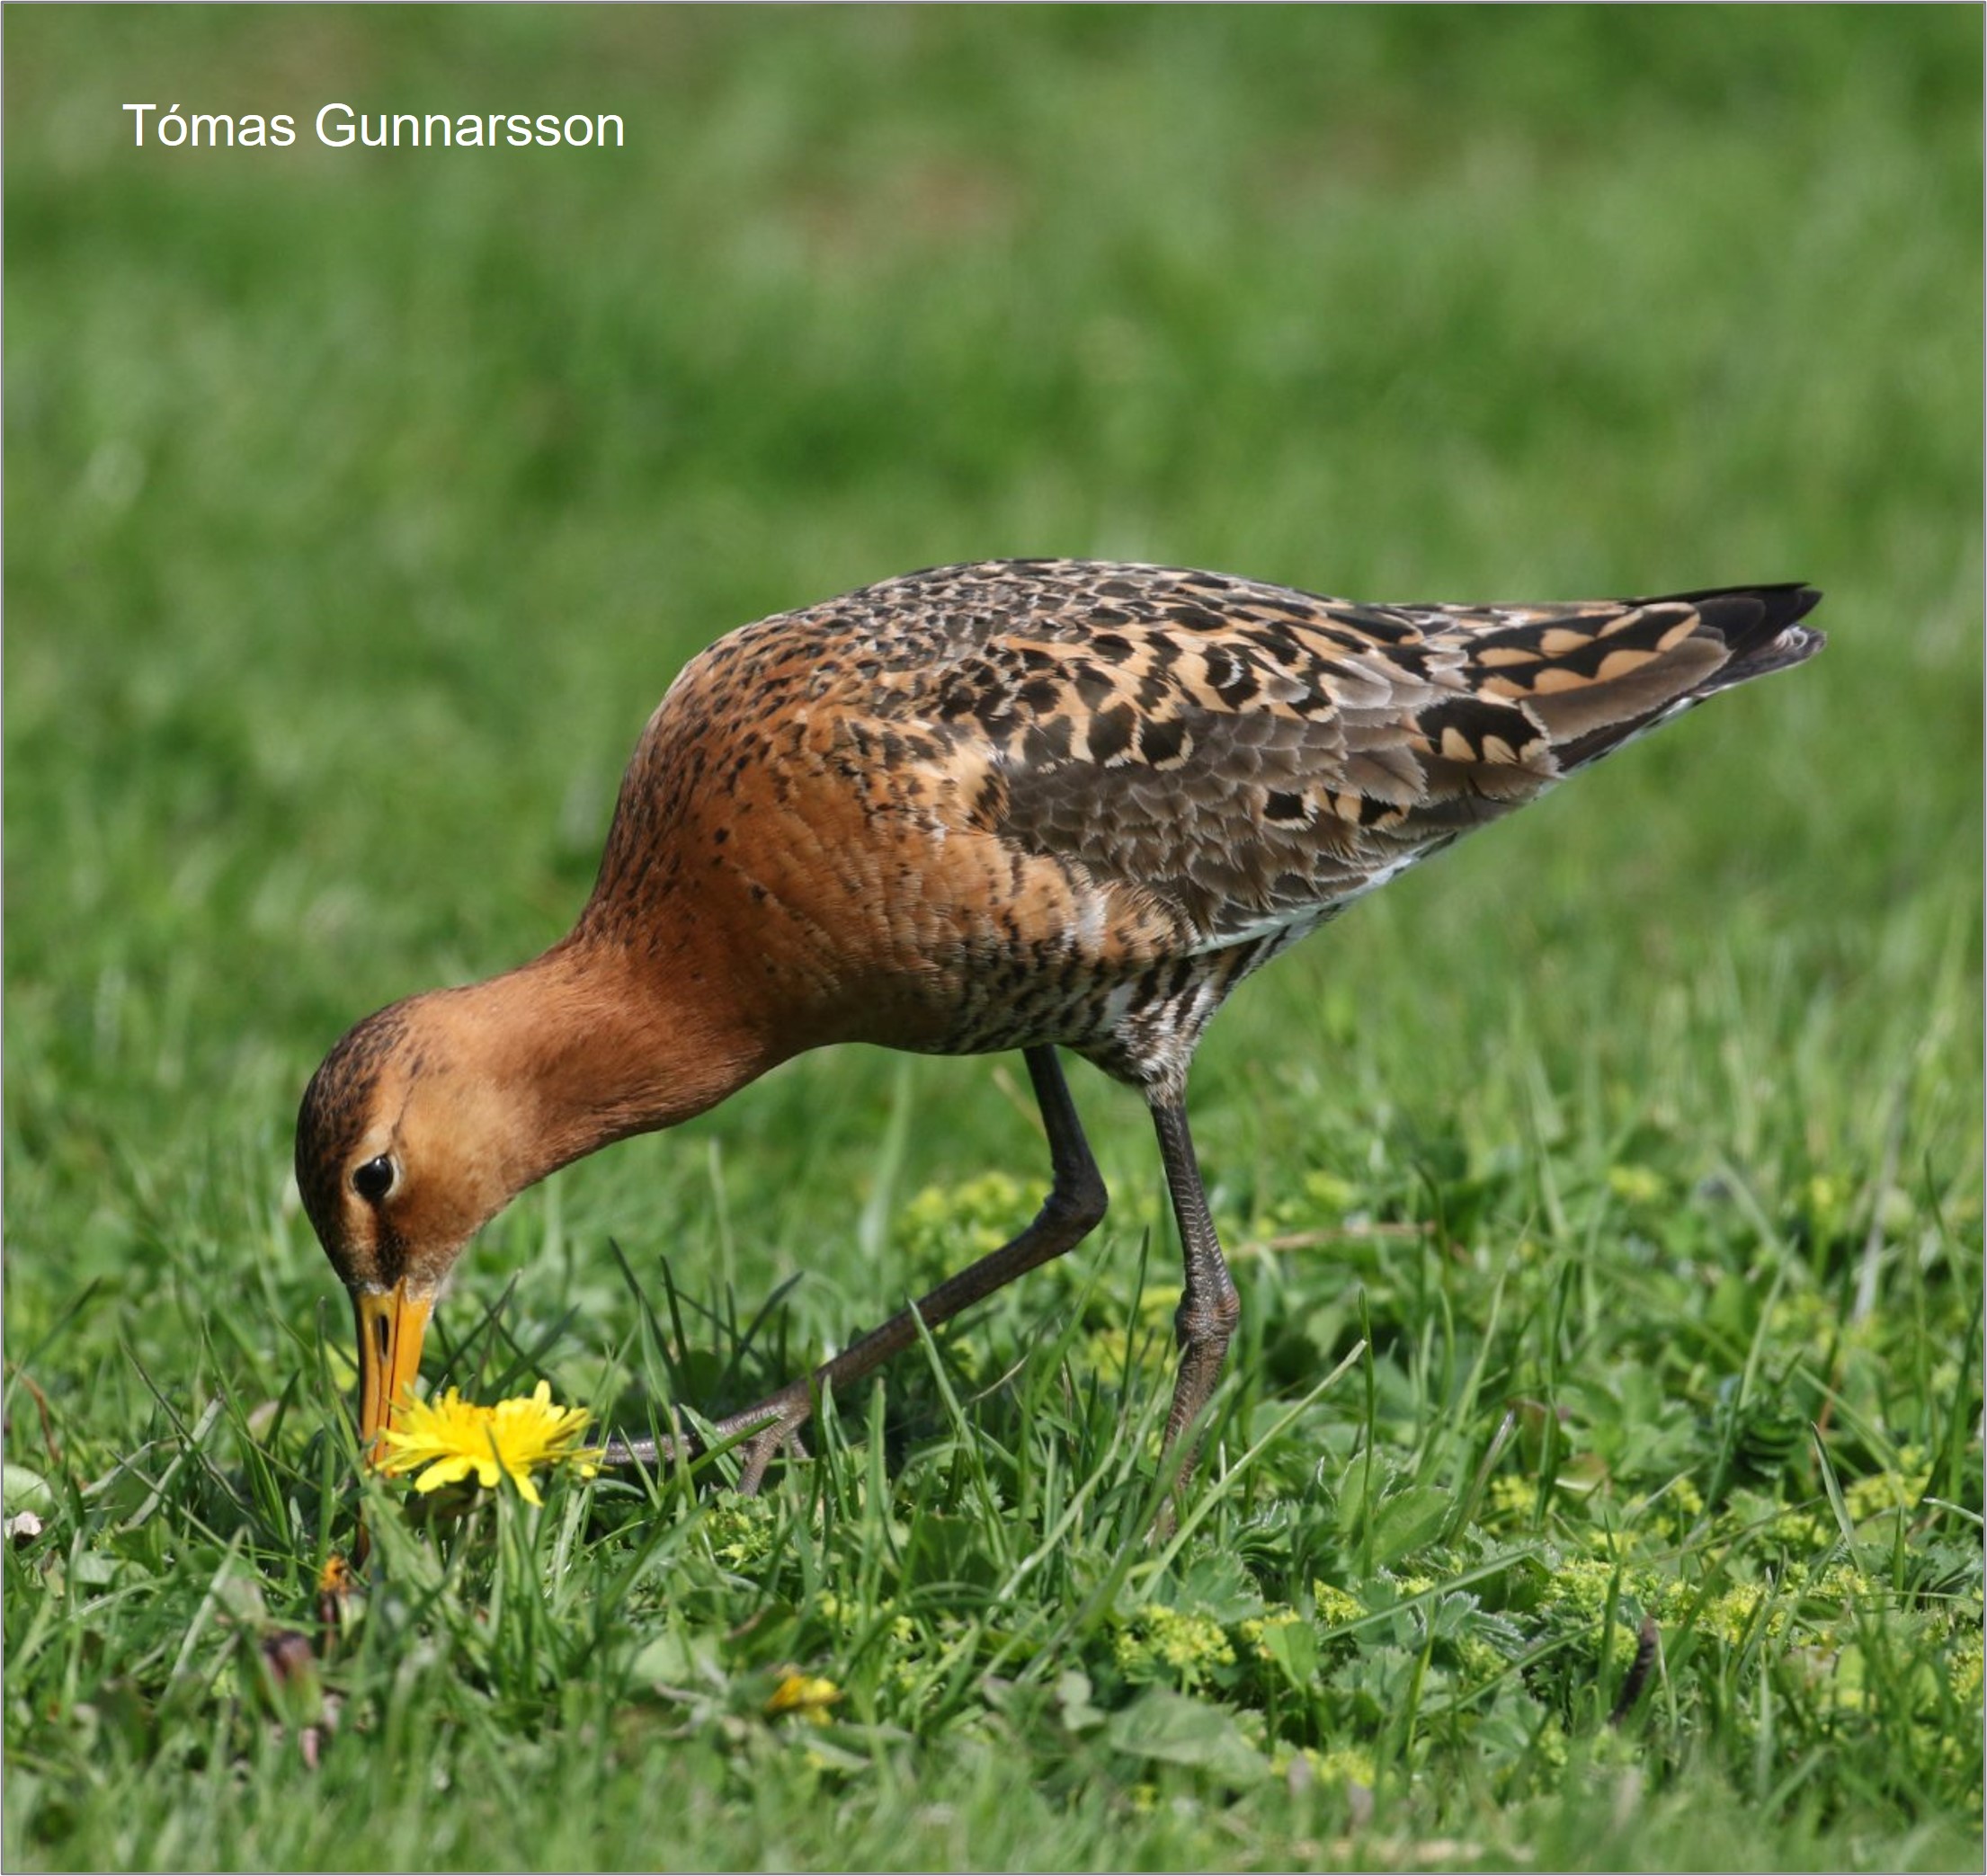
Black-tailed Godwit

“These birds become old friends and open our eyes to the world of migration – Jennifer Gill

Winter Black-tailed Godwit numbers are booming but these are islandica – birds that have benefited from warmer spring and summer conditions in Iceland, as you can read here in: From local warming to range expansion. Their limosa cousins are in trouble in their Dutch heartlands (with declines of 75%) and there have been similar pressures on the tiny remaining breeding populations in the Ouse and Nene Washes, as you can discover in England’s Black-tailed Godwits. A head-starting project in the Washes is boosting the number of chicks; so much so that released birds now make up more than a quarter of this fragile population. Red-listing has shone a spotlight on this threatened subspecies, attracting the funding needed for intensive conservation action.
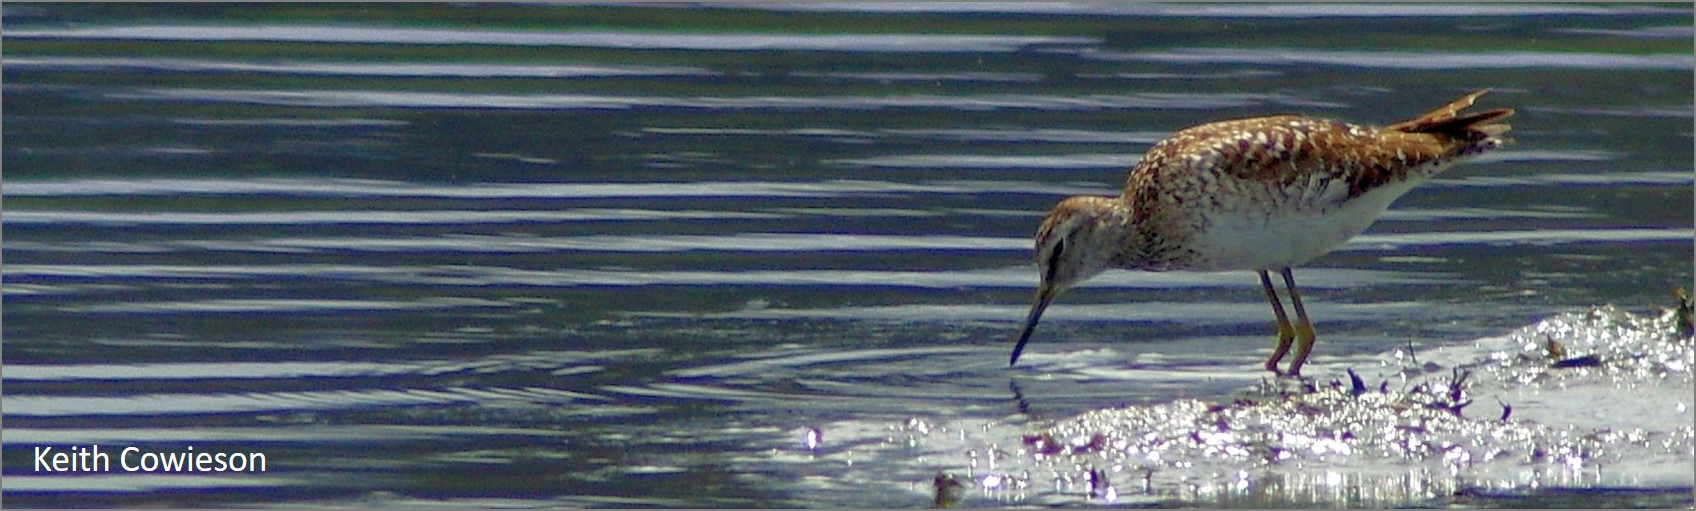
Ruff

“But then, good grief, in May and June, I’m treated to a different plume; A glorious crown, I gush and swoon – and then, no doubt, I change my tune. – Jess French

Some Ruff spend the winter months in the UK and numbers are boosted in spring as birds pass through on their way from Africa to Scandinavia and the Baltic countries. Occasionally, males in glorious breeding attire will display in leks, perhaps attracting the attention of females. As a (very) scarce breeder, Ruff automatically earns a place on the Red List.

250 years ago, Ruff were breeding between Northumberland and Essex, before our ancestors learnt how to drain wetlands and define a hard border between the North Sea and farmland. Hat-makers, taxidermists and egg-collectors added to the species’ woes and, by 1900, breeding had ceased. The 1960s saw a recolonisation and breeding Ruff are still hanging on. Lekking males cause excitement in sites as disparate as Lancashire, Cambridgeshire and Orkney, and there are occasional nesting attempts. Habitat developments designed to help other wader species may support Ruff but the situation in The Netherlands does not suggest much of a future. Here, a once-common breeding species has declined to an estimated population of 15 to 30 pairs (Meadow birds in The Netherlands).
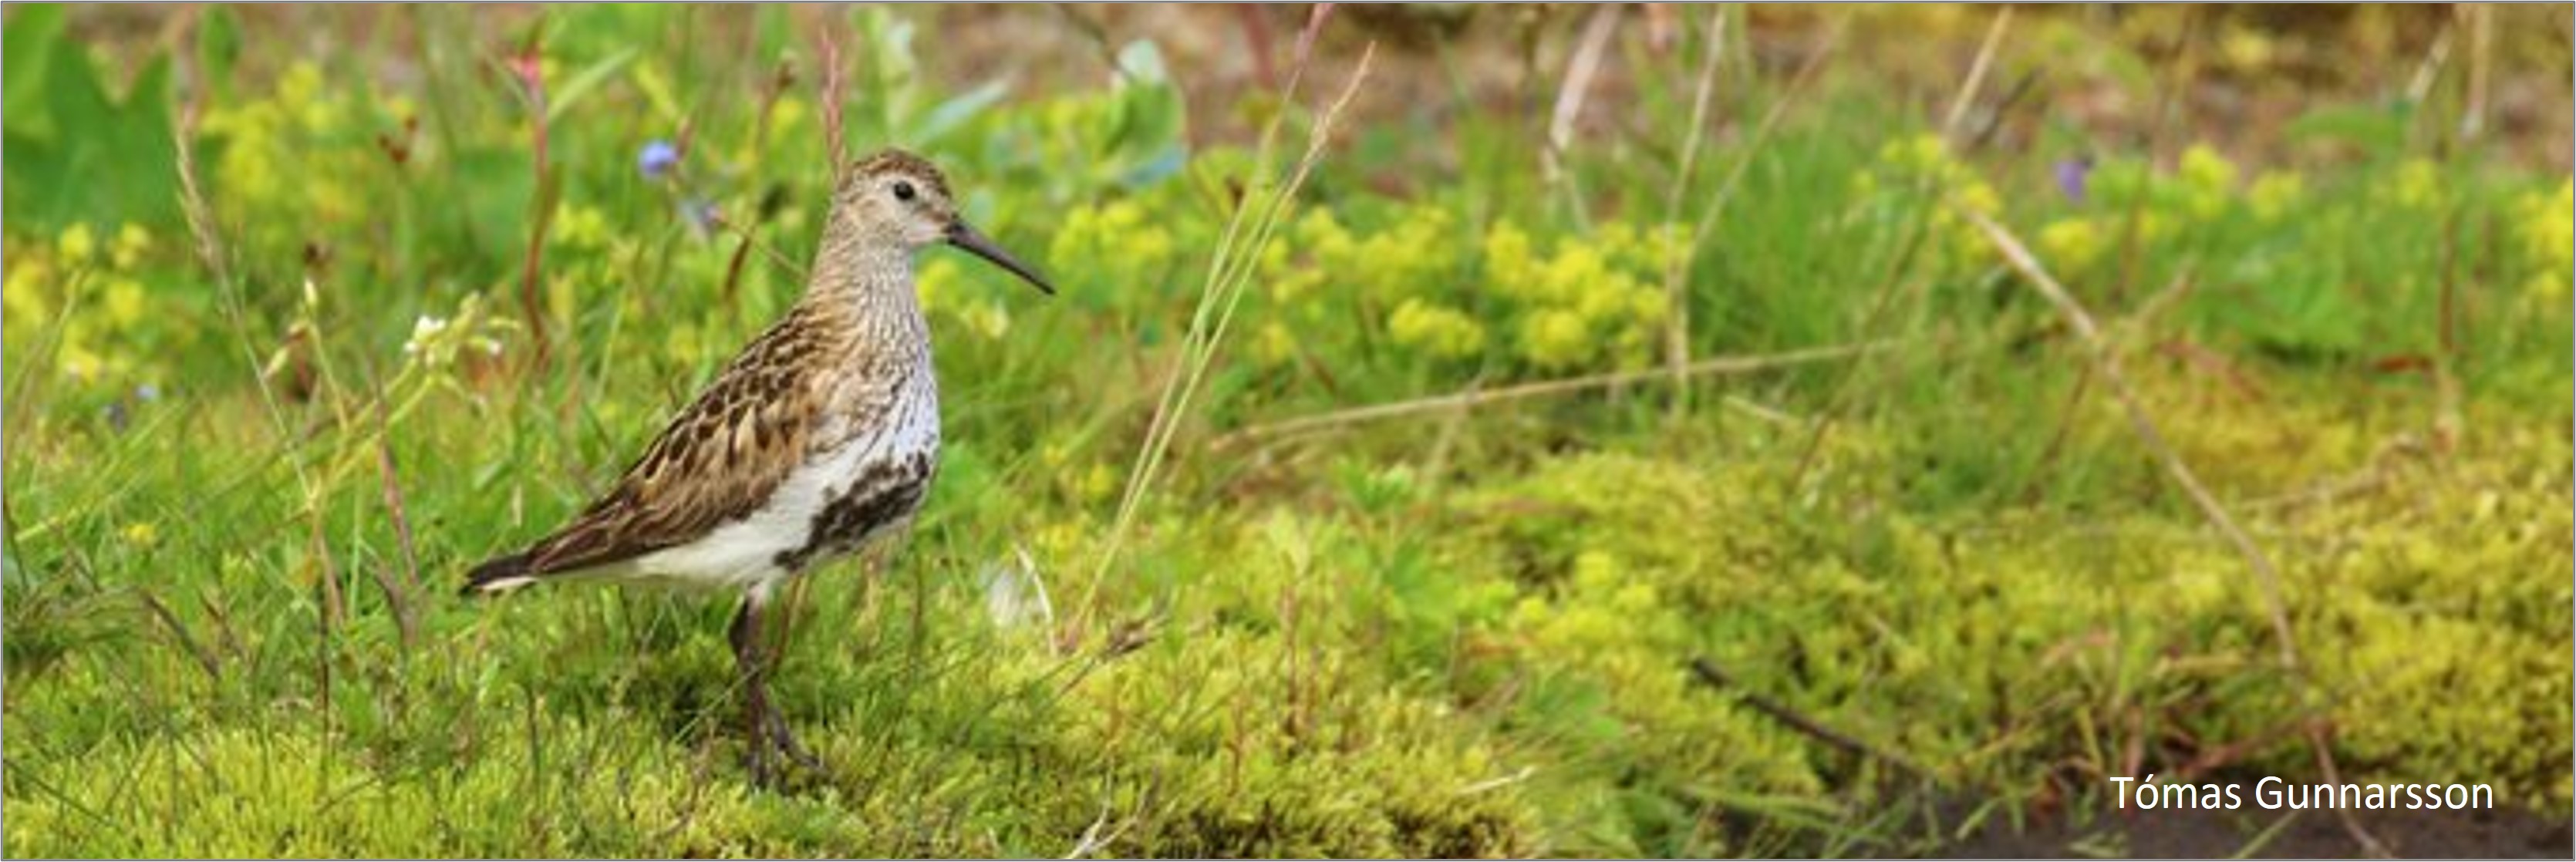
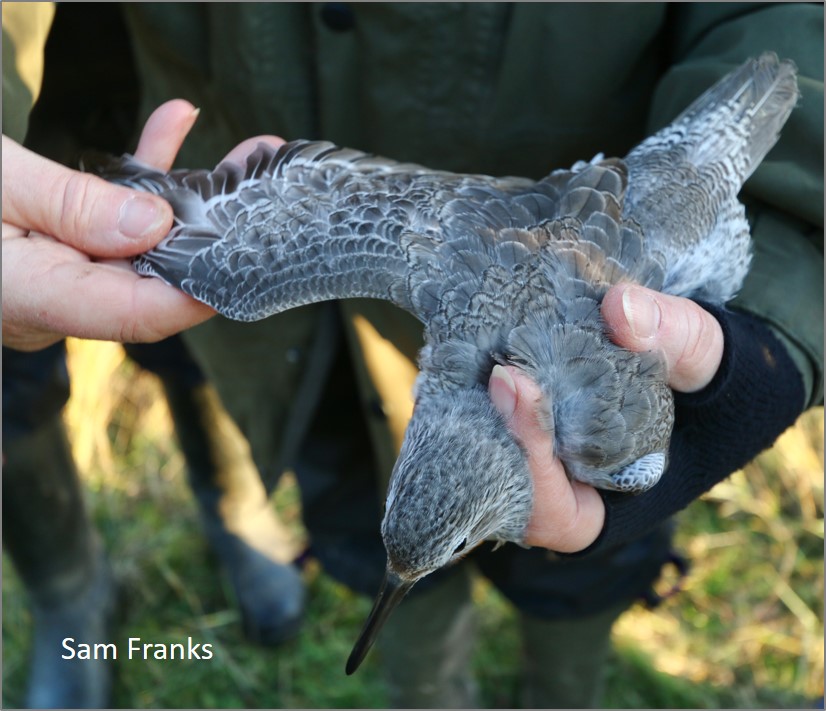
Dunlin

“Memories of sunny days, swirling flocks of waders and blisters from closing metal rings still linger. How can a bird that was so numerous less than 50 years ago now be Red-listed?” – Graham Appleton

There are good reasons for the addition of Dunlin to the UK Red List; breeding numbers of the schinzii race have declined significantly and the number of wintering alpina Dunlin in Great Britain dropped 10,000 between two periods that were only eight years apart, as you can read in this blog about population estimates for waders.

The fall in breeding numbers is probably the bigger problem, as indicated by range reductions in successive breeding atlas periods (1968-72, 1988-91 and 2008-11). It’s hard to monitor what is happening to numbers on a year-by-year basis because the breeding distribution is too patchy and thin to be picked up via the Breeding Bird Survey. Alarm bells are being raised in Ireland, where numbers have dropped to between 20 and 50 pairs (Status of Rare Breeding Birds across the island of Ireland, 2013-2018), and in the Baltic, where numbers have fallen by 80% since the 1980s. There’s a WaderTales blog about Finnish Dunlin.

The winter decline in the UK may or not be an issue, although it has to be considered as part of large-scale moderate losses across the whole of western Europe. There is a theory that, over the years, as winter conditions on the continental side of the North Sea have become less harsh, new generations of juvenile alpina have settled in countries such as the Netherlands, instead of continuing their southwesterly migrations from northern Russia. Once a wintering site has been chosen, individuals are site faithful, so one ends up with newer generations on the continent and ageing adults in the UK and Ireland. WeBS counts for Dunlin are half what they were 25 years ago.

Purple Sandpiper

“It’s an easy species to overlook, the Purple Sandpiper. For a start, they’re not purple” – Mark Eaton

Purple Sandpiper earns its red listing because a very small number of pairs nest in Scotland. Proof of successful breeding is rare and the species may drop off the list at the next review, as Temminck’s Stint did in 2015. Extirpated species (birds that no longer breed) are not red-listed.

In winter, the rocky coasts of the UK are home to Purple Sandpipers from the Arctic, with a suggestion that North Sea coasts, south of Aberdeen, mainly play host to birds from Spitsbergen and northern Scandinavia, with Greenlandic and Canadian birds more likely to be found further north and on the Atlantic coast. Coastal numbers declined by 19% between 1997/98 and 2015/16, according to the Non-estuarine Waterbird Survey, and WeBS counts suggest numbers have at least halved over a period of 25 years. The Highland Ringing Group has shown that the number of young Purple Sandpipers has been declining on the Moray Firth, suggesting several years with relatively poor breeding success, for birds migrating from the northwest, or short-stopping by new generations of youngsters, as discussed for Dunlin. Perhaps they are wintering in Iceland these days?

Woodcock

“Like clockwork, I’d encounter this sight at 7 pm each summer evening as one flew over my head in the back garden, heading towards the thick woodland. – Megan McCubbin

The presence of Woodcock on the Red List causes heated debate; how can this still be a game species? Red-listing is indisputable; the most recent survey by BTO & GWCT showed that there was a decline in roding males from 78,000 in 2003 to 55,000 in 2013, with the species being lost from yet more areas of the UK. Each autumn, the number of Woodcock in the UK rises massively, with an influx of up to 1.4 million birds. Annual numbers depend upon seasonal productivity and conditions on the other side of the North Sea. A recent report on breeding wader numbers in Norway, Sweden and Finland, shows that breeding populations of Woodcock in this area are not declining (Fennoscandian wader factory).

The UK’s breeding Woodcock population is under severe threat from things such as increased deer browsing and drier ground conditions but winter numbers appear to be stable. The difference in conservation status between breeding and wintering populations is reflected in the fact that Woodcock is on both the Red List and the Quarry List, for now. There is a WaderTales blog (Conserving British-breeding Woodcock) that discusses ways to minimizes hunting effects on British birds. These guidelines from GWCT emphasise the importance of reducing pressures on British birds.

Red-necked Phalarope

“The evening light was beautiful, and it was just amazing to watch it spinning around in characteristic fashion” – Dawn Balmer

Red-necked Phalaropes that breed in Shetland and a few other parts of northern Scotland appear to be an overflow from the Icelandic population; birds which migrate southwest to North America and on to the Pacific coastal waters of South America. This BOU blog describes the first track revealed using a geolocator.

The Red-necked Phalarope was never a common breeder and came under pressure from egg-collectors in the 19th Century. Numbers are thought to have recovered to reach about 100 pairs in Britain & Ireland by 1920. Numbers then fell to about 20 pairs by 1990, so the latest estimate of 108 pairs in 2018 reflects conservation success (The Rare Breeding Birds Panel). Given the restricted breeding range and historical declines, it is unlikely that the next review will change the conservation status from Red to Amber, despite the recovery of numbers.

In conclusion

The Red List creates some strange bedfellows. In the book, Turtle Dove follows Herring Gull (right); a bird with links to love and romance and another with at best the charm of a roguish pirate. But the List works; it creates an evidence-base that help those who devise agricultural subsidy systems, advise on planning applications, license bird control and prioritise conservation initiatives.

Into the Red aims to raise awareness of the UK’s most at-risk bird species, eleven of which are waders, and to raise money to support the Rare Breeding Birds Panel and BTO research scientists. This is a follow-up to Red67, published in 2019 and based on the Red List from 2015. It is sad that this version covers 70 species, rather than 67. Worryingly, the first Red List, produced in 1990, only had 36 species on it.

Into the Red is a lovely book that captures the thoughts and images of a generation. Details of how you can order a copy from the BTO can be found here.


WaderTales blogs are written by Graham Appleton (@GrahamFAppleton) to celebrate waders and wader research. Many of the articles are based on published papers, with the aim of making shorebird science available to a broader audience.

Iceland’s waders need a strategic forestry plan

More and more trees are being planted in lowland Iceland – and further increases are planned, in part encouraged by the suggestion that this will mitigate for climate change. Forestry is potentially bad news for Whimbrel, Black-tailed Godwit and other waders that breed in open habitats, and which migrate south to Europe and Africa each autumn. Are there ways to accommodate trees while reducing the damage to internationally important populations of waders?

Pressure on Iceland’s breeding waders

Iceland is changing; more people want second homes in the countryside, the road network is being developed to cope with more and more tourists, new infrastructure is needed to distribute electricity, agriculture is becoming more intensive and there is a push to plant lots more trees. The south of the country is seeing the most rapid loss of open spaces, providing opportunities to study how these incursions affect ground-nesting species, particularly breeding waders.

One of the big changes, especially in Southern Iceland, has been the planting of non-native trees, as shelter belts around fields and country cottages and, more significantly, as commercial crops. Iceland has been largely treeless for hundreds of years but climatic amelioration has facilitated rapid forestry development in areas where tree growth was previously limited by harsher environmental conditions. Seeds of some non-native species are blown on the wind for a kilometre or more, to germinate in open land, well beyond the edge of planned forests.

Most of the new forests are in lowland areas, where we also find the most important habitats for many ground-nesting bird populations. Lodgepole pines may be good news for Goldcrest and Crossbills but not for species such as Golden Plover, Dunlin & Redshank. For breeding waders, the most obvious impact of a new forest is direct loss of breeding habitat but trees can have wider effects, by providing cover for predators and breaking up swathes of open land that are used at different stages of the breeding season. Little is currently known about how predators in Iceland use forest plantations but any perceived risks of predator presence and reduced visibility is likely to influence densities of birds in the surrounding area.

Iceland’s open habitats have suited breeding waders for hundreds of years

Aldís E. Pálsdóttir’s studied changing bird populations in lowland Iceland during her PhD at the University of Iceland, in collaboration with researchers from the University of East Anglia (UK) and the University of Aveiro (Portugal). Among the most concerning of these changes is the rapid expansion of forestry in these open landscapes.

Assessing the potential impacts of trees

In a 2022 paper in the Journal of Applied Ecology, Aldís assesses whether densities of ground-nesting birds are lower in the landscape surrounding plantations and whether these effects vary among plantations with differing characteristics. She and her fellow authors then quantified the potential impact of differing future afforestation scenarios on waders nesting in lowland Iceland.

Forestry currently covers about 2% of Iceland’s land area so the potential for growth is massive. In 2018, the Icelandic government provided additional funding to the Icelandic forest service to increase the number of trees planted, with a goal of enhancing carbon sequestration. As forestry primarily operates through government grants to private landowners, who plant trees within their own land holdings, plantations typically occur as numerous relatively small patches in otherwise open landscapes. These features make Iceland an ideal location in which to quantify the way that plantations affect densities of birds in the surrounding habitats, and to identify afforestation strategies that might reduce impacts on globally important wader populations.

To measure the effects of plantation forests on the abundance and distribution of ground-nesting birds, in particular waders, 161 transect surveys were conducted between May and June 2017. To avoid systematic bias arising from possible “push effects” of corralling birds in front of the surveyor, surveys were conducted along transects that started either at the edge of the plantation, with the observer moving away (79 transects), or started away from the plantation, with the observer walking towards it (82 transects). Please see the paper for the full methodology. The variation in density with distance from plantation was used to estimate the likely changes in bird numbers, resulting from future afforestation plans, and to explore the potential effects of different planting scenarios.

Bird communities change around plantations

Snipe densities are highest close to young forests

On the transects, 3713 individual birds of 30 species were recorded. The nine most common species (excluding gulls, which rarely breed in the focal habitats) were seven waders (Oystercatcher, Golden Plover, Dunlin, Common Snipe, Whimbrel, Black-tailed Godwit & Redshank) and two passerines (Meadow Pipit & Redwing). These species accounted for 88% of all birds recorded.

  • Of the seven waders, Snipe was the only one found in significantly higher numbers closer to plantations. Snipe density declined by approximately 50% between the first (0-50 m) and second (50-100 m) distance intervals, suggesting a highly localised positive effect of plantations on Snipe densities.
  • Densities of Golden Plover, Whimbrel, Oystercatcher, Dunlin and Black-tailed Godwit all increased significantly with increasing distance from plantations. Dunlin and Oystercatcher showed the largest effect (~15% increase per 50 m), followed by Whimbrel (~12%), Black-tailed Godwit (~7%) and Golden plover (~4%).
  • Although Redshank did not show a linear relationship with distance from plantation edges, densities were lowest close to the plantation edge.
  • There were more Redwings close to woodland edges but Meadow Pipit showed no change in density with distance from plantations.

Golden Plover, Whimbrel and Snipe were found in lower densities close to the tallest plantations (over 10 m), when compared to younger plantations (tree height 2m to 5m), suggesting that the impact of forests gets more pronounced as the trees grow. Plantation density and diameter had no additional effect on the species that were in lower densities closer to the plantations, implying that the mere presence of plantations induces the observed changes in abundance. See the paper for more details.

The bigger picture

Aldís Pálsdóttir and Harry Ewing walked every step of every transect and made detailed counts of what they saw – data that are invaluable when considering local impacts of plantations – but the paper becomes even more interesting when the authors look at the bigger picture. When plantations are distributed across these open landscapes, in different configurations, what will be the accumulated effects on the numbers of breeding waders? They estimate likely changes in abundance resulting from planting 1000 ha of plantation in different planting scenarios, ranging from a single block to lots of small patches.

  • Planting 50 smaller patches of 20 ha, instead of 1000 ha of forest in one large patch, is estimated to double the resulting decline in abundance (because there is more forest edge and hence a bigger effect on more open habitat)
  • This effect increases even further as the patches become smaller; in their models, planting 1000 blocks each of 1 ha would have nine times the impact of planting one forest of 1000 ha.
  • Proximity of woodland seems to be the driver of local distributions of breeding waders so the authors suggest that the amount of edge (relative to area) should be minimised, to reduce the impact of a plantation – which means making forests as near circular as possible.

It is clear that fewer larger forestry plots are likely to be less bad than lots of small, local plantations, in terms of the effects on wader populations. The figure below illustrates how much more land is affected when one woodland is replaced by four with the same total area. The grey area (equivalent to a 200 metre annulus) accounts for 88 hectares in the one-patch illustration and 113 hectares for four patches.

An urgent need for action (and inaction!)

Iceland holds large proportions of the global nesting populations of Golden Plover (52%), Whimbrel (40%), Redshank (19%), Dunlin (16%) and Black-tailed godwit (10%) (see Gunnarsson et al 2006) and is home to half or more of Europe’s Dunlin, Golden Plover and Whimbrel. Data in the table alongside have been extracted from Annex 4 of the report, which was discussed at the 12th Standing Committee of AEWA (Agreement on the Conservation of African-Eurasian Migratory Waterbirds) in Jan/Feb 2017.

Aldís measured the areas of 76 plantations in her study, using aerial photographs. The total area of woodland was about 2,800 ha and the total amount of semi-natural habitat in the surrounding 200 m was about 3,600 ha. Using the reduced densities that she found on the transects and the direct losses for the plantations themselves, she estimates potential losses of about 3000 breeding waders, just around these 76 forest plots. Extrapolating this figure to the whole of the Southern Lowlands of Iceland, the total losses resulting from all current plantations are likely to already be in the tens of thousands. Worryingly, the densities measured on the transects in this paper (even 700 m from forest edge) were well below those measured (slightly differently) in previous studies of completely open habitat, suggesting that losses may already be significantly higher than estimated in the paper.

A scary statistic in the paper is that “6.3% of the Icelandic lowlands is currently less than 200 m from forest plantations”. Given the incentives to plant lots more trees, this is particularly worrying for species such as Black-tailed Godwits, the vast majority of which breed in these lowland areas (between sea level and 300 metres).

Non-native trees are spreading beyond the boundary of a planned forest

It has been suggested that breeding waders might move elsewhere when impacted by forestry but migratory wader species are typically highly faithful to breeding sites. If birds are not going to move to accommodate trees, then perhaps plantations should be located where bird numbers are naturally low, such as in sparsely or non-vegetated areas, at higher altitudes and on slopes? Planning decisions could usefully be informed by surveys of breeding birds, to identify high-density areas that should be avoided.

The severe impact that planting forests in open landscapes can have on populations of ground-nesting birds emphasises the need for strategic planning of tree-planting schemes. Given Iceland’s statutory commitments to species protection, as a signatory to AEWA and the Bern Convention on the Conservation of European Wildlife and Natural Habitats, and the huge contribution of Iceland to global migratory bird flyways, these are challenges that must be addressed quickly, before we see population-level impacts throughout the European and West African Flyway.

To learn more

The take-home message from this work is clear. Local planning decisions and the ways in which forestry grants are allocated are producing a patchy distribution of plantations across the lowlands of Iceland, and this is bad news for breeding waders.

The paper at the heart of this blog is:

Subarctic afforestation: effects of forest plantations on ground-nesting birds in lowland Iceland. Aldís E. Pálsdóttir ,Jennifer A. Gill, José A. Alves, Snæbjörn Pálsson, Verónica Méndez, Harry Ewing & Tómas G. Gunnarsson. Journal of Applied Ecology.

Other WaderTales blogs that may be of interest:

Forest edges

Work by Aldís Pálsdóttir (pictured right)

Changing agricultural systems in Iceland (work by Lilja Jóhannesdóttir)


WaderTales blogs are written by Graham Appleton (@GrahamFAppleton) to celebrate waders and wader research. Many of the articles are based on published papers, with the aim of making shorebird science available to a broader audience.

Power-lines and breeding waders

Around the globe, people are consuming more energy, much of which is delivered to cities, towns, individual homes and businesses via over-head electricity cables. In a paper in Ibis, Aldís E Pálsdóttir and colleagues investigate the effects of power-lines on Iceland’s breeding waders. This is the first of several papers from Aldis’ PhD thesis, in which she seeks to understand how forestry and the sprawl of new infrastructures (roads, cottages and power-lines) are changing bird distributions within what were previously open landscapes.

Breeding waders in Iceland

Iceland is a hot-spot for breeding waders, holding half or more of Europe’s Dunlin, Golden Plover and Whimbrel, in a country that is a bit smaller then England. In a 2017 report prepared by AEWA (Agreement on the Conservation of African-Eurasian Migratory Waterbirds), in response to concerns about the effects of afforestation on Iceland’s waterbirds, we learn that:

“Iceland is second only to Russia in its importance as a breeding ground for migratory waterbirds in the AEWA region. It supports the most important breeding populations in Europe for six species of waders and is the second most important country for three.”

Data in the table alongside have been extracted from Annex 4 of the report, which was discussed at the 12th Standing Committee of AEWA in Jan/Feb 2017.

Power lines

For waders nesting in Iceland, power-lines are a new addition to a once-open landscape. Pylons provide potential nesting opportunities for Ravens and perches for Gyrfalcons, while the wires between them are a collision risk. Under power-lines, carcases of swans, geese and waders may attract scavenging Arctic Foxes and Ravens, thereby increasing the activities of nest predators. Perhaps these actual and perceived threats affect densities of breeding waders in the vicinity? Or might birds react to something less obvious, such as the emission of UV light or electromagnetic radiation?

In Iceland, the vast majority of electricity is produced from hydropower or geothermal sources, often long distances from the areas in which the power is used. A new move to develop the wind energy sector has the potential to further add to the number of power lines and introduce them in more areas of the country. Much of the increase in electricity production over the last fifty years has been used to fuel industries such as aluminium smelting and there is the potential to further expand generation capacity, perhaps exporting some electricity to other countries.

Much of Iceland’s electricity is used to power aluminium smelters (here, in Hvalfjörður)

Counting the birds

Aldís counting waders on a transect

Aldís conducted the fieldwork for this study between the 6th May and the 20th June 2019, counting birds along 85 transects of between 300 m and 500 m, running perpendicular to power lines. The full methods are described in the paper but it is interesting to see that they included a check to see whether there were different results if walking towards or away from the power lines. Each transect was divided into intervals of 50 m length, each corresponding to 1 hectare of surveyed land. For each power line, Aldís recorded the number of cables, pylon characteristics, and the height and voltage of the line.

Results

In total, 1067 birds of 21 different species were recorded on the 85 transect surveys. Over 90% of sightings were of eight species considered in the subsequent analysis: Dunlin, Black-tailed Godwit, Golden Plover, Meadow Pipit, Redshank, Redwing, Snipe and Whimbrel. Having analysed the data, Aldís and her colleagues concluded that:

  • For all eight species combined, the areas closest to the power lines (0-50 m) supported densities of approximately 112 birds/km2 (±13 SE) which increased by approximately 58% to 177 birds/km2 (±24 SE), in the sector that was between 450-500 m away from the power-lines. On average, there was a 4% increase in abundance between adjacent 50 metre bands.
  • At the species level, Redshank (figure below) and Whimbrel density increased significantly with distance from power lines (18% and 9% per 50 m, respectively) but no other significant effects were detected for other species individually.
  • There were no detectable difference between types of power-lines or relating to the voltages of the electricity they carried.

Implications of the research

In the paper’s discussion there are questions as to why densities of Redshank and Whimbrel (right), in particular, are lower near power-lines. The two species behave differently while nesting, with Redshanks being nest-hiders and Whimbrel nesting in the open, but previous research has shown that their nest predation rates are quite similar (see Where to nest?).

The reason why significant reductions in density close to power lines were apparent for Whimbrels and Redshanks (but not for other species) is not clear but the authors suggest that sample sizes may have been too low for there to have been measurable effects for species such as Dunlin and Golden Plover (below).

Power lines could have direct impacts, such as increased collision risk, but this may be difficult to establish directly, as the authors suggest that carcasses are likely to be quickly removed by scavengers.

Ravens may find it easier to find and predate nests if there are pylons or wires on which to perch but it will be hard to discriminate between an actual predation effect, reducing numbers in areas close to power-lines, and the avoidance of risky areas because of a perceived threat of predation. This is discussed in Mastering Lapwing conservation.

Given the depressed density of ground-nesting bird species in the vicinity of overhead power lines, the authors of the paper suggest that burying power lines might be a better option, even though there would be temporary disturbance to the ground during installation.

What are the implications for Iceland’s breeding waders?

It would be interesting to calculate how many Whimbrel and Redshank (left) territories would be lost over the course of a 50 km run of power-lines through open landscapes – and then extrapolate that to 500 km and 5,000 km. As shown in the earlier table, 75% of Europe’s Whimbrel breed in Iceland. How vulnerable are they to power-line infrastructures and what might be the impact on a breeding population of over 300,000 pairs?

This is the first of several papers from Aldis’ thesis, in which she seeks to understand the current rapid changes to Iceland’s lowland landscapes. Links to other blogs and papers will be added as they appear. It should soon be possible to reveal the combined effects of these incursions into open wader habitats, by considering plans that might affect these areas over the next twenty years, working out potential losses and setting these numbers in a flyway context.

This paper is published as:

Effects of overhead power-lines on the density of ground-nesting birds in open sub-arctic habitats. ALDÍS ERNA PÁLSDÓTTIR, JENNIFER A. GILL, SNÆBJÖRN PÁLSSON, JOSÉ A. ALVES, VERÓNICA MÉNDEZ, BÖÐVAR ÞÓRISSON & TÓMAS G. GUNNARSSON. Ibis. https://doi.org/10.1111/ibi.13089

Here’s a link to another blog about Aldís Pálsdóttir’s research: Iceland’s waders need a strategic forestry plan.

A complementary set of papers by Lilja Jóhannesdóttir investigated how changes to Iceland’s farming may also be affecting breeding waders. These are discussed in three WaderTales blogs:


WaderTales blogs are written by Graham Appleton (@GrahamFAppleton) to celebrate waders and wader research. Many of the articles are based on published papers, with the aim of making shorebird science available to a broader audience.

Dunlin: tales from the Baltic

Veli-Matti Pakanen, Kari Koivula  and colleagues have been studying Finnish Dunlin for nearly twenty years. These are schinzii birds that breed in coastal grazing meadows around the Baltic Sea. Several papers have been published, as you will see below, some of which are based on information collected using geolocators attached to leg-flags. Dunlin numbers in coastal Finland are dropping quickly, so this research is important to the conservation of the species. In a 2020 paper, Veli-Matti and colleagues ask whether intensive geolocator-based studies are having a negative effect on individual birds in this already-declining study population.

Global Dunlin

Up to ten races of Dunlin have been identified, which together encircle the globe. Most Dunlin spend the non-breeding season in the northern hemisphere and all migrate north in spring. The breeding and wintering ranges of the various races are summarised at the end of this blog. Here, the focus is on Baltic schinzii Dunlin, a small part of a race that largely winters in coastal North Africa and breeds in southern Scandinavia, Northern Europe, the British Isles, Iceland and southern Greenland.

According to Wetlands International, there were between 4.3 and 6.8 million Dunlin worldwide in 2015, with about one million breeding birds within Europe (BirdLife International). Whilst it is acknowledged that numbers are declining, the large range of the species means that it is still considered to be of ‘least concern’.

Different populations are faring differently. In his description of the changing Dunlin distribution in European Breeding Bird Atlas 2, John Calladine points out that there have been major losses across Europe, including Britain & Ireland, and that Baltic populations ‘are now considered threatened’. The Baltic schinzii population was most recently estimated as between 500 and 640 pairs – less than a fifth of the estimate in the 1980s. John highlights gaps in knowledge that research by the team in Finland and other groups elsewhere are helping to fill.

Migration and survival of schinzii

Dunlin that visit the UK are mostly of the schinzii and alpina races, as indicated in this map. There has been a noticable drop in the number of schinzii birds stopping off in July.

In pre-geolocator days, Ole Thorup and colleagues analysed recovery information available for Dunlin breeding around the Baltic, using 40 years of ringing data from Finland, Sweden, Denmark and Germany. At that stage there were only six mid-winter recoveries in N and NW Africa. The analysis emphasised the importance of wintering and stop-over sites in the Baltic, the Wadden Sea, SE and S England, the Atlantic seaboard of France, and the Iberian Peninsula. Paper in Ardea (2009).

Pakanen et al investigated changes in the survival rates of schinzii Dunlin nesting in Denmark, based on ringing and recaptures of a marked population. They found that annual apparent survival rates dropped from 0.817 to 0.650 between 1990 and 2006, equivalent to a doubling of the chance of dying in any given year. Paper in Bird Study (2016). The importance of monitoring survival rates is discussed in the WaderTales blog: Measuring shorebird survival.

Nests in these flat coastal marshes along the Baltic coast are increasingly susceptible to summer flooding

The use of geolocators enabled Veli-Matti Pakanen to add more detail to the migration story in the 2018 paper, Migration strategies of the Baltic dunlin: rapid jump migration in the autumn but slower skipping type spring migration. He and his colleagues showed that autumn migration is faster than spring migration, characterised by fewer stationary periods, shorter total stopping time and faster flight. The Wadden Sea was found to be an important autumn staging area for all of the tagged birds. Some birds stopped once more before reaching Mauritania. On spring migration, more sites were visited on the way north. The important conservation message from the paper is that Baltic Dunlin may be especially vulnerable to rapid environmental changes at their staging and wintering areas. (In Travel advice for Sanderling there is a suggestion that annual survival is relatively low for birds that winter in Mauritania).

In a 2015 paper in Ornis Fennica, Pakanen et al reported on the results of a single-year analysis of survival rates, concluding that there were no strong effects of leg-flagged geolocators on return rates or reproduction in schinzii Dunlin. However, they did suggest that “long term evaluations that capture the full suite of environmental conditions and assess impact on brood care are needed”. This is a question which leads us neatly on to the 2020 paper: Survival probability in a small shorebird decreases with the time an individual carries a tracking device.

Long-term tracking of individuals

To understand the range of pressures that migratory birds face, one needs to know where individuals spend their time, as was demonstrated in Spoon-billed Sandpiper: Track & Trace and Teenage Waders. Waders of a range of species have been wearing geolocators for ten or more years now, either the same devices on birds which have evaded capture, or a series of tags, when data have been downloaded and replacement tags fitted. These long-term surveys are developing our understanding of the repeatability of migratory behaviour and how birds deal with variable weather patterns, but is there a long-term cost to the individual birds that are tasked with finding out this important information?

This Dunlin wore a ring-mounted geolocator for one year, to collect movement data

Effects of tracking devices on survival are generally considered to be small. However, most studies to date have focused on birds that were caught in one breeding season and recaptured in the following season, to retrieve the geolocator and download the data. In their 2020 paper, Veli-Matti Pakanen and colleagues were able to investigate the possible accumulation of negative effects when individuals have carried the tracking devices for longer periods. Survival rates for tagged birds were compared with 338 colour-ringed birds that were followed for all or part of the period 2002 to 2018.

In the summers of 2013 & 2014, fifty-three adult schinzii Dunlin were fitted with leg-flag mounted geolocators, with a mass equivalent to 1.5 – 2.0% of body-mass. Of these birds, 17 tags were retrieved after one year and 9 after two years. Other marked birds could not be caught and carried their tags for longer periods (3 or 4 years). The research team found that Dunlin carrying a geolocator had reduced chances of survival. Their models suggest that annual survival of colour-ringed males was 0.813. For a bird that carried a geolocator for a year, annual survival probability declined to 0.748 and to 0.581 for birds that carried the geolocator for at least 2 years. Their data suggest that the reduction in survival rates was greater for females than males, even though females are larger than males.

Summer flooding of coastal breeding area is becoming an increasing problem, and likely to get worse with sea-level rise and more chaotic weather patterns

In a thorough Discussion, the authors consider reasons why tags on small waders may be reducing survival, either through ongoing stresses, impacting on things such as feeding efficiency and the energy needed during migration, or because the extra burden means that tagged birds find it harder to cope with occasional periods of tough environmental conditions. They comment on the condition of the skin under removed geolocators – something that other researchers night want to look out for.

As anyone studying breeding waders will know, nest-trapping to retrieve tags is not easy, especially if adults lose their clutches when incubation has only just started, due to flooding, predation etc. Birds may end up carrying tags for longer than intended. The authors “recommend that the detrimental effects of tagging may be avoided by developing attachment methods that are automatically released after one year, e.g. biodegradable materials”.

Balancing costs and benefits

The results from the Pakanen study of long-term survival suggest that requiring a small wader to carry a geolocator for several years may have an impact on survival. As in all mark-recapture studies, researchers are urged to assess the costs to the individual when seeking to understand what might be affecting the viability of a population.

Four previous WaderTales blogs have discussed tag effects:

Details of the Dunlin tagging effects study:

Survival probability in a small shorebird decreases with the time an individual carries a tracking device.

Veli-Matti Pakanen, Nelli Rönkä, Thomson Robert Leslie, Donald Blomqvist, Kari Koivula. Journal of Avian Biology (2020): https://doi.org/10.1111/jav.02555

Four other papers relating to this Finnish Dunlin study

Grazing by cattle is an important management tool in coastal meadows. Pakanen et al studied the impact of trampling on artificial nests and concluded that even recommended stocking rates were too high for chick numbers that could deliver a sustainable population. Paper in Biodiversity and Conservation (2011). (Redshank on British estuaries are similarly vulnerable to trampling – see Big Foot and the Redshank Nest).  

In a follow-up paper in 2016, Pakanen et al concluded that Dunlin populations could be sustained in grazed coastal meadows as long as there was no active grazing before 19 June. Meadows with grazing cattle attracted breeding birds but there was insufficient breeding success for sustainability. Paper in Ecology & Evolution (2016).

If these schinzii Dunlin chicks return to breed they are likely to try to nest nearby; something that needs to be considered when considering conservation measures

Dunlin are strongly philopatric, with both male and female chicks recruiting to suitable habitat close to natal sites. In a paper in Ibis (2017), Pakanen et al show that natal dispersal of Dunlin is strongly linked to the size of their natal site and how isolated the site is. They suggest that inbreeding may be avoided by creating a network of suitably sized patches (20–100 ha sites), no more than 20 km apart from each other. These may work as stepping stones for recruiting individuals. These results are corroborated by a 2021 microsatellite study in BMC Ecology and Evolution which shows genetic differentiation and isolation by distance within the Baltic Dunlin population.

Up to ten races

In western Europe we see three races of Dunlin – alpina, arctica and schinzii. Wintering birds are almost exclusively of the alpina race, which head north and east to northern Scandinavia, Russia and Siberia in spring. The other northern race is arctica, a very small Dunlin that breeds in low numbers in NE Greenland and possibly Spitzbergen. Schinzii has a very large breeding range, spanning the Baltic, southern Scandinavia, Northern Europe, the British Isles, Iceland and SE Greenland. There is huge variation in the timing of breeding of schinzii, as birds do not return to breeding sites in SE Greenland until the end of May, at the same time as schinzii Dunlin being studied by Veli-Matti Pakanen and colleagues in Finland will have their first young chicks.

Further east, centralis Dunlin replace alpina. Many of these birds use the Central Asian Flyway. Further east still, we find sakhalina that use the East Asian/Australasian Flyway (EAA). Two other subspecies have been identified breeding within the EAA Flyway, the more southerly kistchinski birds and actites, which breeds furthest south, on the Russian island of Sakhalin, on a similar latitude to the UK.

It is generally accepted that there are three Dunlin subspecies in North America. In autumn, arcticola head west from northern Alaska and NW Canada and follow the EAA Flyway, pacifica fly south along the Pacific coast from SW Alaska and hudsonia migrate from central northern Canada using the Atlantic Americas Flyway.


WaderTales blogs are written by Graham Appleton (@GrahamFAppleton) to celebrate waders and wader research. Many of the articles are based on published papers, with the aim of making shorebird science available to a broader audience.

Waders on the coast

The UK’s coastline is of international importance because of the numbers of waders that it supports. In winter it accommodates over a third of Europe’s wintering Oystercatcher, Ringed Plover, Bar-tailed Godwit and Knot, as well as an increasing number of Sanderling.

Wintering waders on the UK’s estuaries are counted every month but those on the 17,000 km of open coast are only counted once a decade. There are good reasons for this disparity, given the much higher development pressures on estuaries and the need for regular monitoring of sites that are designated and protected. However, this does mean that we have very little information about wintering Purple Sandpipers, the vast majority of which are not covered by monthly Wetland Bird Surveys (WeBS). Over three-quarters of the UK’s Ringed Plovers are missed too, along with over half of the Sanderling and Turnstones and nearly half of the Curlew.

The last Non-estuarine Waterbird Survey took place during the winter of 2015/16, as discussed in the WaderTales blog NEWS and Oystercatchers. Jenny Gill and I undertook counts on Great Cumbrae and along stretches of the Clyde coast, in Scotland, an area we had also covered for the 2006/07 survey. We were concerned to count only 84 waders in 2015, compared to 206 in 2006. Details are in the table alongside. We hoped that 900 other people, walking along a total of 9000 km of the UK’s coastline, had been more successful!

The paper summarising NEWS results for the whole of the UK and making comparisons with previous surveys in 1997/98 and 2006/07 was not published until 2021. In the intervening period, the counts were included in two papers about wintering populations of waterbirds in Great Britain and Ireland, that were discussed in Do population estimates matter? and Ireland’s wintering waders. This blog draws heavily on a Twitter thread from the Wetland Bird Survey and the BTO’s press release. The new paper is published in Bird Study.

The big picture

In December 2015 and January 2016, NEWS III volunteers walked along amazing, long, white beaches, surveyed rocky headlands and scrambled the lengths of boulder-strewn coves. Not every kilometre of the coast could be visited but the fact that 50% coverage was achieved meant that estimates could be made of the whole coastline of the United Kingdom, together with the Isle of Man and the Channel Isles.

In terms of absolute numbers, Scotland has consistently supported the majority of the population across all non-estuarine waterbird surveys for Oystercatcher, Ringed Plover, Golden Plover, Lapwing, Purple Sandpiper, Bar-tailed Godwit, Curlew, Redshank and Turnstone. Although this is likely to reflect the relative length of the coastline for Scotland (12,714 km) compared to England (2,705 km), Wales (1,185 km) and Northern Ireland (328 km), Purple Sandpiper, Curlew, Redshank and Turnstone still appear to show a bias towards Scotland.

Using the information collected during the survey, BTO scientists were able to extrapolate estimates of the numbers of open-coast waders in the different countries of the UK and its island dependencies (see table below). The results are published in the journal Bird Study and summarised in the table below.

To evaluate the potential importance of the open coast, NEWS estimates for Great Britain in 2015/16 were compared to average population estimates. For eight species, the open coastline accounts for over 20% of the winter population. The figure of 113% for Purple Sandpipers suggests that more birds may have been present on the coasts of the UK in 2015/16 than in an average year or that the population estimate needs to be revisited. There are no Lapwings or Golden Plover in the table below, as there is no recent, reliable estimate of the national wintering population for either species. The Greenshank line is in italics as the sample size is small.

Ten species are considered in detail in the following sections. The maps were downloaded from the BTO website on 20 March 2021 (https://www.bto.org/our-science/projects/ringing/publications/online-ringing-reports). Comparisons are made between results from the Wetland Bird Survey (WeBS) and the Non-estuarine Waterbirds Survey (NEWS).

Oystercatcher

26% use open coasts. 21% NEWS decline since 1997/98. (WeBS decline 22%).

In December 2015, as we walked around the coast of Great Cumbrae in the Firth of Clyde, pairs of Oystercatchers were already staking out their territories, probably not having travelled anywhere since the previous summer or perhaps even in the last twenty years! Wintering flocks that we saw may well have included breeding birds from inland sites in Scotland, from Iceland and from Norway, together with juveniles and non-breeding sub-adults. NEWS III found that densities of coastal Oystercatchers were highest in Wales but that this is the area in which there had been the biggest declines. Breeding numbers have fallen rapidly in Scotland, as you can read in Oystercatchers: from shingle beach to roof-top.

Lapwing and Golden Plover

There was a 68% drop in Lapwing figures between 1997/98 and 2015/16 and a 59% drop in Golden Plover. NEWS and WeBS counts of Lapwing and Golden Plover are difficult to interpret because birds move readily between the coast and inland fields, in response to local conditions such as lying snow and the wetness of fields. This is further complicated in more prolonged freezing conditions, when flocks of Lapwing fly west and south in search of feeding opportunities.

Grey Plover

3% use open coasts. 71% NEWS decline since 1997/98. (WeBS decline 41%).

The Grey Plovers that we see around the coasts of the UK in December and January breed in Siberia. It has been suggested that one of the reasons for the decline in numbers in Britain & Ireland may be related to new generations of youngsters settling in winter locations on the continental side of the North Sea – a strategy that may now work better, given that winters are not as harsh. It is interesting that losses on open coasts, which many would consider sub-optimal habitats, have been more marked than on estuaries. There’s a WaderTales blog about Grey Plovers.

Ringed Plover

82% use open coasts. 21% NEWS decline since 1997/98. (WeBS decline 47%).

Ringed Plovers are red-listed in the UK because of the decline in winter numbers and the importance of these islands of the hiaticula race. In NEWS III, the vast majority of UK birds were found in Scotland (see earlier table) but densities were highest around the coast of England.  Colour-ring studies in Norfolk showed that breeding individuals can adopt a range of migration plans – some marked birds never left the county and others had winter homes as far away as France, Scotland and Ireland. This dispersal is pretty typical of hiaticula race Ringed Plovers that nest in western Europe and southern Scandinavia. Other races travel very long distances (Well-travelled Ringed Plovers).

Curlew

42% use open coasts. 40% NEWS decline since 1997/98. (WeBS decline 26%).

Large numbers of Curlew arrive in the UK in the autumn, with a strong link between Finland and the estuaries of England and Wales. It is estimated that 20% of Europe’s Curlew winter within the British Isles and any change in numbers has significance for a species that is already listed as near-threatened by BirdLife International. The decline in numbers on open coasts has been greater than that seen in estuaries; it has been suggested that this may relate to the breeding origins of birds using different habitats.

Bar-tailed Godwit

15% use open coasts. 33% NEWS decline since 1997/98. (WeBS decline 21%).

Unlike Black-tailed Godwits, which seek out the gloopiest of mud, Bar-tailed Godwits are perfectly at home on sandy shorelines. Wintering birds are of the race lapponica; these breed in Northern Scandinavia, Finland and western Russia (more here). NEWS III tells us that there has been a larger decline in numbers in coastal areas than on estuaries, perhaps related to the relative suitability of the two habitat types.

Turnstone

68% use open coasts. 29% NEWS decline since 1997/98. (WeBS decline 29%).

Almost all of the UK’s wintering Turnstones are thought to be birds that breed in Greenland and Canada. Declines are consistent between NEWS and WeBS. A Northumberland study has shown that, as numbers have dropped, so birds have withdrawn into areas that are less disturbed by people and dogs (See Disturbed Turnstones). About three-quarters of the UK’s open-coast Turnstones are found in Scotland but they are more thinly spread here than in England.

Sanderling

69% use open coasts. 26% NEWS increase since 1997/98. (WeBS increase 8%).

As discussed in Travel advice for Sanderling, the UK is a pretty good place to spend the winter. Whether the same would have been true for previous generations of Sanderling, that were faced with much colder winters, is open to conjecture. Since 1997/98, the densities of Sanderling in Wales have increased by 712%, by 462% in Scotland and by 85% in England. How long will it be until Sanderling flocks successfully over-winter in Iceland?

Dunlin

6% use open coasts. 51% NEWS decline since 1997/98. (WeBS decline 38%).

Three races of Dunlin can be seen in the UK (as you can read in Which wader, when and why?). Wintering Dunlin are birds of the alpina race, arriving in the UK from Siberia, NW Russia, northern Finland and northern Scandinavia in the late summer. Open coasts around the UK are estimated to accommodate fewer than 20,000 Dunlin. To put this into context, there are six estuaries that each hold more than this total during the winter period.

Purple Sandpiper

Almost all on open coasts. 19% NEWS decline since 1997/98. (WeBS decline 34%).

The rocky coasts of the UK are home to Purple Sandpipers from the Arctic, with a suggestion that North Sea coasts south of Aberdeen mainly play host to birds from Spitsbergen and northern Scandinavia, with Greenland and Canadian birds more likely to be found further north and on the Atlantic coast. Coastal numbers have declined by 19%. The Highland Ringing Group has shown that the number of young Purple Sandpipers has been declining on the Moray Firth, suggesting a period of relatively poor breeding success for birds migrating from the northwest.

Redshank

22% use open coasts. 42% NEWS decline since 1997/98. (WeBS decline 21%).

Perhaps surprisingly, few Redshank cross the North Sea to spend the winter in the UK. Winter flocks are largely made up of home-grown birds and migrants from Iceland. The recent decline in Redshank numbers is thought to be a reflection of changing numbers of British and Irish breeders, although there are no monitoring schemes to provide information about Icelandic birds. Since 1997/98, the number of Redshank on open coasts has dropped by 42% but almost all of the losses have occurred in the period since 2007/08 (37% decline between 2007/08 and 2015/16). Redshank is currently amber-listed in the UK, reflecting falling breeding numbers, but ‘promotion’ to the red list cannot be far off. There is a WaderTales blog about the rapid decline in the number of Redshank breeding on salt-marshes: Redshank – the warden of the marshes.

Summary

The Non-estuarine Waterbird Survey 2015/16 revealed that there have been major declines in abundance of four species since NEWS II in 2007/08, only eight years previously: Lapwing (down 57%), Curlew (down 31%), Redshank (down 37%) and Turnstone (down 32%). Lapwing and Curlew are both red-listed in the UK. The only species to increase is Sanderling (up by 79%).

Given the magnitude of the changes revealed in NEWS III, it is unfortunate that this labour-intensive survey can only be carried out every eight to ten years. Ideally, it might be possible to survey at least a sample of sites on an annual basis. It is certainly to be hoped that funding can be found for NEWS IV within the next few years, and that volunteers will once more be prepared to count waterbirds on beautiful, if exposed, stretches of coastline.

The results of NEWS III are published in a paper in Bird Study:

Wader populations on the United Kingdom’s open coast: results of the 2015/16 Non-Estuarine Waterbird Survey (NEWS-III) and a review of population trends. Humphreys, E.M., Austin, G.E., Frost, T.M., Mellan, H.J., Boersch-Supan, P., Burton, N.H.K. and Balmer, D.E.


WaderTales blogs are written by Graham Appleton (@GrahamFAppleton) to celebrate waders and wader research. Many of the articles are based on published papers, with the aim of making shorebird science available to a broader audience.

Fennoscandian wader factory


blog tem st

Nesting Temminck’s Stint – the smallest of the 22 wader species for which trends are reported

At the end of the summer, vast numbers of waders leave Norway, Sweden and Finland, heading southwest, south and south-east for the winter. In a 2019 paper by Lindström et al, we learn what is happening to these populations of Fennoscandian breeding species, as diverse as Temminck’s Stint and Curlew. The news for the period 2006 through to 2018 is basically pretty good – most populations have been stable and there are even some that have increased – but there are worrying signs for Broad-billed Sandpiper, Red-necked Phalarope and Whimbrel.

Breeding waders of Fennoscandia

blog map
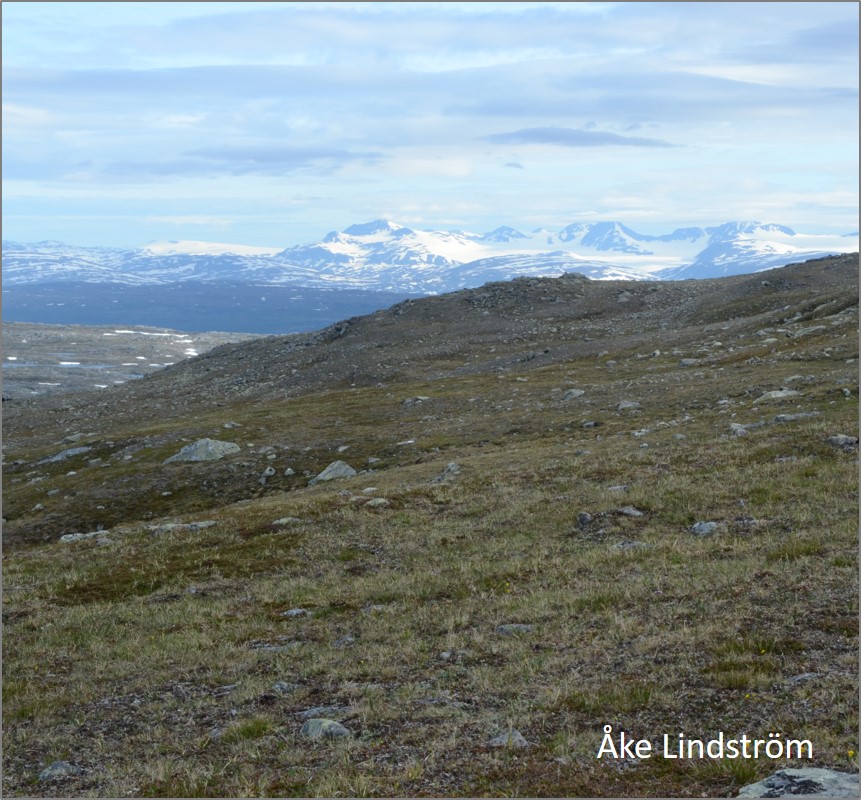
As a volunteer taking part in the Breeding Bird Survey (BTO/JNCC/RSPB) in the UK, I feel that I do my bit to monitor what is happening to local bird population – providing counts that build into national trends. The work involved in delivering indices for breeding waders across the area of Fennoscandia shown in the map is in a different league. Here, counters visit habitats as diverse as forests, wetlands, mires and tundra, within the boreal and arctic areas of Norway, Sweden and Finland. Some survey sites are so remote that access requires the use of helicopters.

Fennoscandia provides important breeding areas for a large set of wader species, and models suggest that these habitats may be particularly vulnerable to climate change, especially increasing summer temperatures. The 2006-18 analysis in Wader Study, the journal of the International Wader Study Group, presents population trends for 22 wader species. The trends are based on 1,505 unique routes (6–8 km long), distributed over an area that’s about four times that of the United Kingdom. 

blog surveyor

The surveys took place across the whole of Norway and Finland, and in the northern two thirds of Sweden, between 58°N and 71°N, which largely coincides with the boreal, montane and arctic regions of Fennoscandia. The systematic distribution of these routes ensures that the main habitats in these countries are sampled in proportion to the area they cover. The paper describes the methodologies used in the three countries and the way that data were combined, especially factors used to translate sightings of individuals into ‘pair-equivalents’.

Overview of results

blog mountainLooking at the results from across Norway, Sweden & Finland:

  • In terms of pure numbers, Golden Plover was the most commonly encountered wader species, followed by Wood Sandpiper, Snipe, Greenshank and Green Sandpiper.
  • The five most widespread species, seen on the highest number of routes, were Snipe, Green Sandpiper, Greenshank, Wood Sandpiper and Common Sandpiper.
  • Wader species richness and the total number of wader pairs were both higher with increasing latitude; the median number of wader pairs per 10 km increased from just below 3 at latitudes 58–60°N, to just above 26 at latitudes 69–71°N.
  • Using a multi-species indicator, the research team found no general change in wader numbers over the period 2006-18.
  • The trends were significantly negative for three species: Red-necked Phalarope (-7.9% per year), Broad-billed Sandpiper (-5.4% per year) and Whimbrel (-1.3% per year).
  • The trends were significantly positive for three species: Oystercatcher (+4.9% per year), Dunlin (+4.2% per year) and Wood Sandpiper (+0.8% per year).
  • There was no significant trend for another 16 species for which encounters were deemed to be frequent enough for analysis.
  • Population trends of long-distance migrants tended to be more negative than those of medium-distance migrants. This is discussed in detail in the paper.

blog wood sp habitat

Focusing on some key species

The Lindström et al paper is a tremendously rich source of information and references. Here are some species-specific highlights.

Oystercatcher. In the context of a species that is declining across NW Europe, the fact that there is a significant increase in Oystercatchers across Fennoscandia may be surprising. However, the authors note that there was a jump in numbers between 2006 and 2007 with little change since then.

blog l graphLapwing. The trends within the three Fennoscandian countries are very different. In Norway, there has been a dramatic decline (-15.2% per year during 2006–2018) and the Lapwing is now nearly extinct in many areas. The trend in Sweden is also significantly negative (-5.8% per year). In Finland, however, where the species is more widespread and numerous, there has been a strong increase (+5.9% per year) during the same period. See figure alongside.

Golden Plover. No significant change overall. There are some country-specific differences in trends, with a moderate decline in Norway being countered by a moderate increase in Sweden. 

Snipe. The overall trend of this species for each country indicates an initial decline followed by an increase. A similar pattern has been noted in the UK’s Breeding Bird Survey over the same period. 

blog whimbrel

Nesting Whimbrel

Woodcock. The trend for 2006–2018 is basically stable and similar in all three countries.

Curlew. There is no significant trend, overall, but populations in Norway and Sweden have declined at the same time that numbers in Finland have increased.

Whimbrel. Fennoscandian trend indicates a decline of 1.3 % per year. Whimbrel is doing poorly in Norway and Sweden but better in Finland. 

Wood Sandpiper. This widespread species has increased slowly (0.8% per year), a trend that is largely driven by Norwegian and Swedish populations.

blog wood sp

Wood Sandpiper was the second most commonly encountered wader

Redshank. The fact that no change was discernible, suggests that boreal and arctic populations are faring much better than the breeding populations further south in Europe. For example, see Redshank – warden of the marsh.

blog RK

Redshank – more obvious than most breeding waders encountered!

Spotted Redshank. The estimated annual decline for Spotted Redshank is 2.8% per year but the species is too thinly spread for this to provide significant evidence of a decline. This rate is very similar to the recent drop in the Wetland Bird Survey index in the UK. See Fewer Spotted Redshanks.

Broad-billed Sandpiper. This species has the second most negative trend among the 22 species analysed (-5.6% per year). The bulk of information comes from Finland where the trend is even more negative (-7.5% per year). Birds head southeast in the autumn to countries bordering the Indian Ocean – areas for which winter trend data are not available. The species is still considered to be of ‘least concern’ but perhaps this designation may need to be revisited?

Dunlin. Breeding birds in the survey area are largely of the alpina race. The overall trend is significantly positive (+4.1% per year), which is in sharp contrast to the strong declines of the schinzii subspecies that breeds around the Baltic Sea, western Finland and further south and west in Europe.

blog rnpRuff. There were major declines in the period immediately prior to this review (Lindström et al. 2015) but changes reported here are lower (-2.3% per year) and the decline is not statistically significant.

Red-necked Phalarope. The authors write, “This species has the most negative trend of all the 22 species [-7.9% per year], with most data coming from Sweden. We do not know the cause of this decline but, given that this species shares its south-eastern migration route with Broad-billed Sandpiper, whose population exhibits the second largest decline, the relevant problems might largely apply somewhere along the migration routes”.

Link to Britain & Ireland

As shown in Which wader when and why? there are strong migratory connections between Fennoscandia and the British Isles. Some waders, such as Green, Common and Wood Sandpipers, pass through on their way south in the autumn, whilst many more fly here for the winter, to take advantage of the warmer maritime climate.

Three wader species with particularly strong links between Fennoscandia and Britain & Ireland are still shot and eaten in these islands. Each autumn, large numbers of Woodcock, Golden Plover and Snipe cross the North Sea. It is difficult to ascertain figures for the number that are shot but there is agreement that the vast majority are winter visitors, as opposed to native birds. The results presented in the paper suggest that there have been no discernible changes in the Fennoscandian populations of these three game species in the period 2006-18. Two earlier WaderTales blogs focus on Woodcock and Snipe in Britain & Ireland:

blog goldie

There has been no significant change in Golden Plover numbers across Fennoscandia

Two WaderTales blogs about wintering waders in Great Britain and the island of Ireland were published in 2019, based on reviews in British Birds and Irish Birds. These were Do population estimates matter? and Ireland’s wintering waders. The six big losers, in terms of wintering numbers in these islands, were Knot, Oystercatcher, Redshank, Curlew, Grey Plover and Dunlin. Knot arrive from Greenland and Canada, with Grey Plover flying from Russia, but it is interesting to think about this Fennoscandian breeding analysis in the context of winter losses of the other four species.

  • Wintering numbers of Oystercatchers have dropped recently in Britain and in Ireland. The population is made up of migrants from Iceland (more about this here), very large numbers from Norway, birds that stay within the British Isles and smaller numbers from other European and Scandinavian countries. Given there is no discernible decline in Fennoscandia, it seems likely that much of the decline can be attributed to a major fall in Scottish breeding numbers (more about this here).
  • Most Redshank wintering in Britain & Ireland are of local or Icelandic origin. Fennoscandian numbers seem to be stable; if there were any changes, these would probably not be apparent in wintering numbers within the British Isles.
  • The Eurasian Curlew has been classified as ‘near-threatened’ and the species is known to be declining in many areas (see this blog about serious problems in Ireland). Ringing shows a particularly strong link between Finland, where breeding numbers seem to be increasing, and Britain & Ireland. The decline in British and Irish winter numbers is probably being driven by lower breeding numbers within the British Isles and in countries such as Sweden, Norway and Poland.
  • There is a theory that new generations of alpina Dunlin may be more likely to winter within Europe’s mainland estuaries, instead of continuing their westward migration across the North Sea. This might explain the apparent anomaly between the 4.1% per annum rise in Fennoscandian numbers and recent winter declines of 3% in Britain and over 20% in Ireland.

Going forwards

blog helicopter

Some of the survey areas were in particularly remote areas

Many of the study squares that were covered during these surveys are a long way from the main centres of human population in Norway, Sweden and Finland. The governments of the three countries are to be congratulated for supporting this important monitoring, which relied on the commitment of hundreds of volunteers. It is to be hoped that these surveys will continue and that further species-focused work will be able to explain some of the differences across Fennoscandia, particularly between eastern and western areas. The rapid declines in numbers of two species that migrate southeast each autumn (Broad-billed Sandpiper and Red-necked Phalarope) highlights the need for better information about what is happening on the flyway linking Fennoscandia with the Arabian Sea and coastal countries of the Indian Ocean.

Paper

Population trends of waders on their boreal and arctic breeding grounds in northern Europe: Åke Lindström, Martin Green, Magne Husby, John Atle Kålås, Aleksi Lehikoinen & Martin Stjernman. Wader Study 26(3)

Click on the title of paper to access it on the International Wader Study Group website. Paper is only available to members of IWSG. If you have read the whole of this blog you’ll probably want to join!

blog barwit

Nesting Bar-tailed Godwit in smart summer plumage


GFA in Iceland

Graham (@grahamfappleton) has studied waders for over 40 years and is currently involved in wader research in the UK and in Iceland.  He was Director of Communications at The British Trust for Ornithology until 2013 and is now a freelance writer and broadcaster.


Sixty years of Wash waders

wwrg tt balance

Weighing a Turnstone

The Wash Wader Ringing Group (WWRG)** started with a bang on 18 August 1959, when the team made a catch of 1,132 birds in a Wildfowl Trust rocket-net at Terrington, in Norfolk. Over the years, cannon have replaced rockets, catches have become generally smaller and the scientific priorities have been refined, but the Group continues to focus upon discovering more about the waders that use the Wash. This blog attempts to summarises what has been learnt about the waders that rely upon the Wash, the vast muddy estuary that lies between Lincolnshire and Norfolk, on the east coast of England.

** The Wash Wader Ringing Group changed its name to the Wash Wader Research Group in 2022, reflecting the broader range of studies that have evolved over the years.

Wee quiz: What’s the best match between these Wash waders and the countries that they are quite likely to have come from? Answers at the end of the blog:

  • Species: Bar-tailed Godwit, Black-tailed Godwit, Curlew, Oystercatcher, Sanderling & Turnstone
  • Countries: Canada, Finland, Greenland, Iceland, Norway & Russia

Sixty years ago, the first goal was to understand where the vast flocks of waders that visit the Wash came from – a task that would provide great insights into the way that the whole East Atlantic Flyway works. In this time, over 300,000 birds have been caught and ringed on the Wash, as you can see in the table below. Equally importantly, hundreds of bird-ringers from across the UK and scores of visitors from around the world have joined WWRG teams, in order to learn more about the study of shorebirds. Further international collaboration has been fostered through overseas visits by WWRG members and emigration of some key personnel. The impact of the Group is truly global, as you can read in the WWRG report for 2014/2015.

wwrg table

A total of 307,226 birds is impressive, especially when some of the species totals are compared to the national totals of the BTO Ringing Scheme for the whole of Britain & Ireland since 1909. WWRG is responsible for over 40% of the Grey Plover, Knot, Sanderling and Bar-tailed Godwit, with Grey Plover topping the list at nearly 60%. These are terrific achievements for a group of volunteers. I don’t have the figures but I reckon that Nigel Clark has been responsible for the largest number of catches.

wwrg box

Firing box connected to 4 cannon-nets

In the early days, rocket nets were borrowed from the Wildfowl Trust for an annual summer week of catches, but the development of cannon-nets gave opportunities for all-year ringing. The intensity of the Group’s activities grew in the 1970s, when there was a threat to build a freshwater reservoir on the mudflats. For a couple of years, Clive Minton (founder and leader) persuaded us to visit fortnightly, so that we could get better data on weight-gain and turn-over, using a mixture of cannon-netting and mist-netting. Everything we knew was published by the Group as The Wash Feasibility Study in 1975. These days, the Group gets together about ten times a year for catching and colour-ring-reading sessions.

wwrg oldies

By catching and ringing large numbers of the key species that visit the Wash, the Group was able to generate maps showing what are now well-known patterns of migration (see Which wader, when and why?). Early on in the Group’s history, there was a focus on nine species, with Black-tailed Godwit added as a tenth when numbers increased. Each of these species has its own section below. The maps were prepared for the Wash Wader Ringing Group 2016/2017 Report by Ryan Burrell, using data stored within the BTO archives. Blue dots represent WWRG-ringed birds that have been found abroad. Red triangles represent foreign-ringed birds caught on the Wash. The base maps used are by courtesy of Natural Earth (www.naturalearthdata.com).

Oystercatcher

wwrg map OC
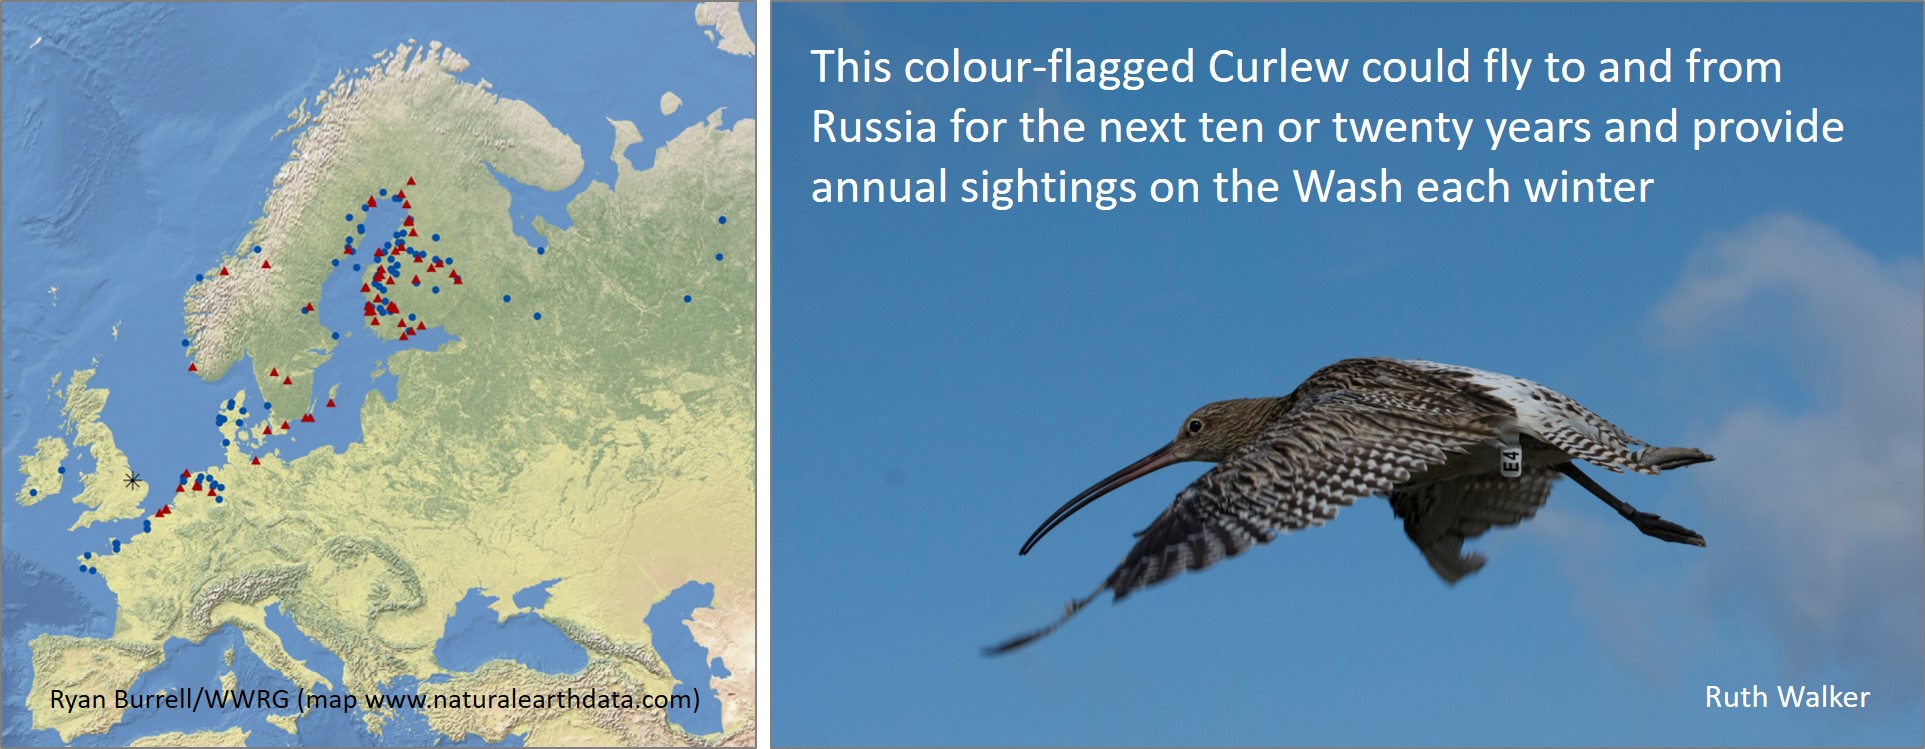
The map alongside clearly demonstrates the strong link between the Wash and Norway. Other interesting things that have been discovered about Oystercatchers:

  • They live a long time. An Oystercatcher that we caught at Friskney on 30 July 1976 broke the longevity record for a BTO-ringed wader when it was shot in France on 4 April 2017 (41 years 1 month and 5 days). It was ringed as an adult so we don’t know the exact age – but it must have been at least 43 years old. There’s a WaderTales blog with a list of longevity records for BTO-ringed waders.
  • When life gets tough, Oystercatchers fail to complete their autumn moult, retaining some of their outer primaries for an extra year. The ability to complete moult and annual survival rates are both affected by cockle and mussel supplies on the Wash. There’s more about this in two papers in Biological Conservation and the Journal of Applied Ecology.

Grey Plover

wwrg GV GVIn the early days of the WWRG, Grey Plovers occurred in much smaller numbers than they do now. Writing in an article about the first 40 years of the Group, Clive Minton told the story of the first catch of 100, made in 1963, that was celebrated with three bottles of champagne provided by the late Hugh Boyd, delivering on an incentive that he had promised.

  • Over half of the Grey Plover that have been ringed in Britain & Ireland since 1909 have been ringed by WWRG since 1959 (58.9%)
  • All of the Grey Plover using the Wash breed in Siberia. Some birds spend the winter on the Wash but there are autumn moulting flocks of birds that will go on to winter in other parts of Britain & Ireland, and spring and autumn passage of birds that travel as far south as West Africa.
  • Grey Plover are late to leave the Wash, with the last departures not occurring until the start of June. Unsurprisingly, they are some of the last waders to return at the end of summer, which puts pressure on birds to finish moult before the short, cold days of winter. Some adults fail to complete primary moult, especially if food supplies are low. There is more about Grey Plover moult in this WaderTales blog.

wwrg map GV KN

Knot

wash knot

First-winter Knot (subterminal bands on wing coverts and, as yet, unmoulted juvenile fethers on upper-parts)

Knot (or Red Knot) are truly international waders, as is shown in this map of movements of islandica  (and a few canutus) birds  to and from the Wash. Several WWRG members have been heavily involved in efforts to understand the decline in numbers of the rufa subspecies in Delaware Bay (on the North American eastern seaboard) and Clive Minton has been at the heart of efforts to explain the sudden drop in survival of piersmai and rogersi adults that winter in Australia and migrate to Arctic Russia via the Yellow Sea (see Wader declines in the shrinking Yellow Sea).

  • We are still learning about Knot migration. The cluster of reports of WWRG-ringed birds in Northern Norway looks odd on this map projection but it turns out that this is a well-used stopping-off point for islandica Knot heading for northern Greenland and NE Canada. This route was first confirmed in 1985, when a joint Durham University and Tromsø University expedition caught 18 Wash-ringed birds in a total catch of 1703 birds.
  • The dot in Siberia looks odd but isn’t. This will be a bird of the canutus race, small numbers of which pause on the Wash in autumn and spring, on their way between the Russian Arctic and west Africa.
  • wwrg net set

    Setting cannon-nets

    Many birdwatchers visit the Wash in autumn and winter to see the swirling Knot flocks at Snettisham and Holme. If high tide is at first light, Knot and other waders sometimes roost on Heacham Beach, giving the occasional opportunity to make a significant catch. The most recent of these, on 11 February in 2012, included 2757 Knot, 77 of which were already wearing rings.

  • Knot numbers on the Wash are highest in autumn. After moulting, many birds fly west. Colour-flagging by WWRG is designed better to understand these movements.
  • The most recent analysis of wader populations in Great Britain showed that there was a drop of nearly 20% in wintering Knot numbers (from 320k to 260k) in less than a decade (see Do population estimates matter?). Regular catches on the Wash will help produce estimates of annual survival rates and age ratios of the islandica subspecies.

Sanderling

wwrg sanderling
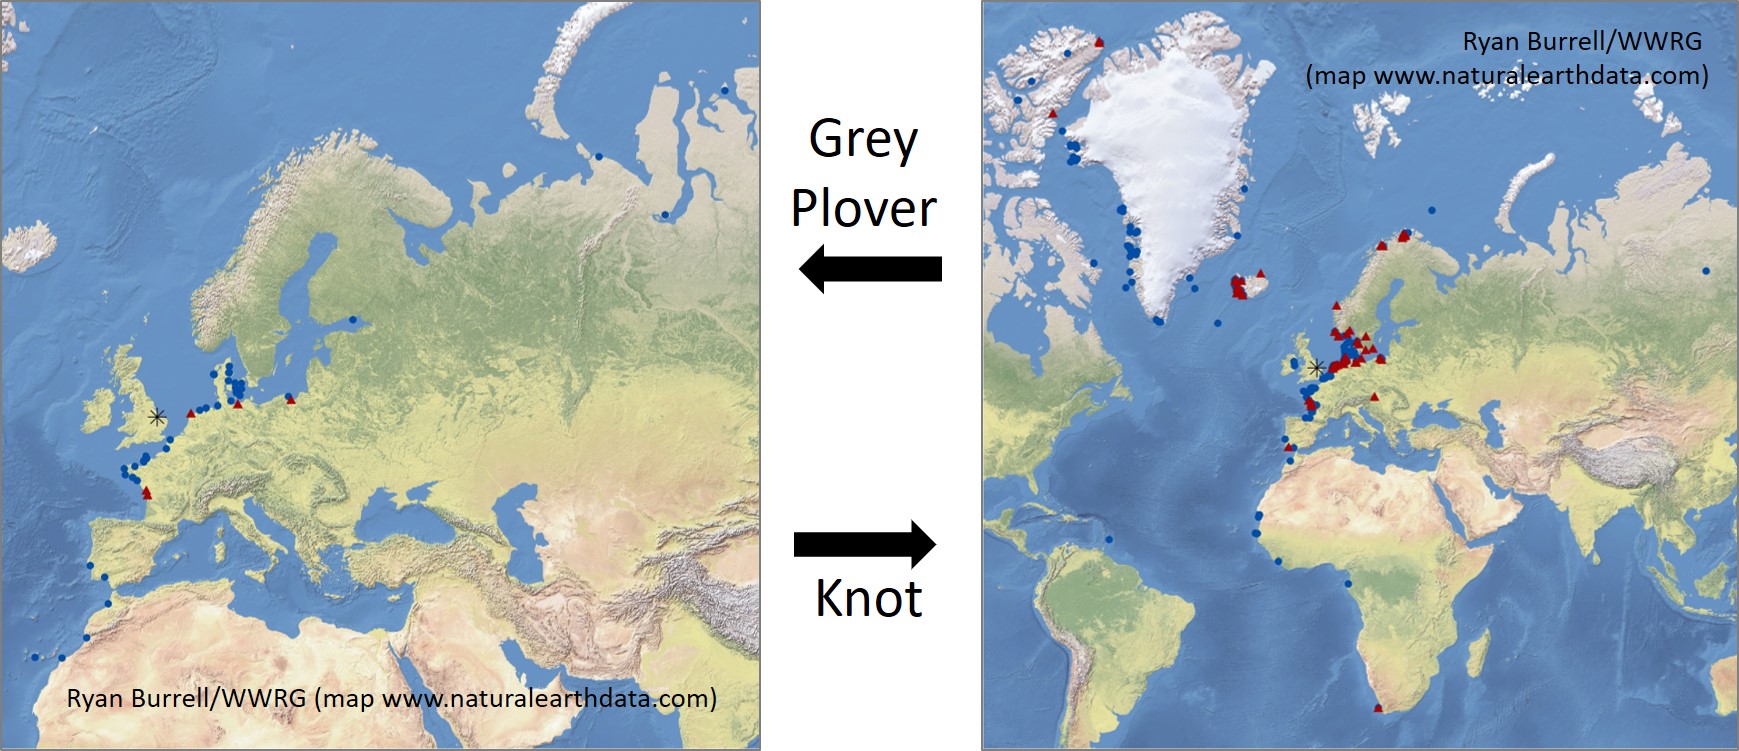
The biggest catches of Sanderling are generally in the summer, when the Wash is a meeting point for birds from Greenland and Siberia. July can sometimes see catches of 200 or more birds. Traditionally, a Sanderling catch was the curtain-raiser at the start of Wash Week, an opportunity for the whole team to make one catch before splitting into ‘Terrington’ and ‘Lincolnshire’ teams for the rest of the main summer trip.

  • Wintering Sanderling on the Wash are thought to be exclusively of the race that heads northwest in the spring, to Greenland via Iceland.
  • Late summer and spring see the addition of birds passing through on their way from/to Siberia and extra birds from Greenlandic breeding areas.
  • I well remember the first time we caught a Sanderling (on 26 July 1975) wearing an Italian ring (caught in Italy 9 May 1975). Thanks to Jeroen Reneerkens (whose work is covered in this blog) I now understand that this is probably a bird that migrates from Namibia to Greenland in spring, via the Mediterranean. It will have been on its way back to Namibia when caught in July.

wwrg map SS DN

Dunlin

wash dunlin

Sam Franks, looking for the buffy tips on inner coverts, which distinguish first-year birds from adults

Nearly half of the waders caught by WWRG have been Dunlin – a total of 140,168 up until the end of 2018. There were really big flocks of Dunlin in the 1970s but numbers have dropped over the years, with peak counts now half what they were, according to WeBS data.

  • We caught over 3,500 Dunlin in one week in 1976 but the annual total has exceeded 1,000 in only four of the last ten years. Partly, this reflects a change in behaviour in the summertime, with fewer waders roosting on fields and hence less catchable.
  • Three races of Dunlin visit the UK. Our winter birds are alpina, from Siberia, NW Russia and northern Scandinavia. A lot of July birds are schinzii, breeding in the UK and as far north as Greenland, and we occasionally try to convince ourselves that we have caught an arctica from northern Greenland.
  • Data collected for the WeBS survey suggest that national winter totals have dropped by over 40% in 25 years. This could perhaps partly be explained by a redistribution of alpina, with new generations of young birds settling in wintering areas on the other side of the North Sea. Warmer winters may well make this a more practical proposition than in the 1970s. There’s more about this in this paper.

Black-tailed Godwit

wash blackwit

Newly ringed Black-tailed Godwit, caught in a mist-net at night.

Black-tailed Godwits became a priority species in 1995, when Jennifer Gill (University of East Anglia) started a project to study the movements of individuals, using colour-rings. Nearly 25 years later, the WWRG-ringed Black-tailed Godwits have contributed data to numerous papers, largely focusing upon migration.

  • The Wash is a hugely important area for moulting islandica Black-tailed Godwits. Some birds stay in East Anglia for the winter but others move south and west within the UK, west to Ireland and south to France, Portugal and Spain.
  • There are several blogs about Black-tailed Godwits in this WaderTales contents list.

Bar-tailed Godwit

One of the key things that was learned from the sudden decline in annual survival rates in a range of species that use the Yellow Sea (as mentioned above) is a need for regular monitoring of marked birds. The WWRG’s Scientific Committee set up colour-flagging projects for Bar-tailed Godwit, Curlew and Grey Plover, in order to increase the reliability of estimates of annual survival for three species that the Group does not catch in sufficient numbers to generate good retrap histories. Birdwatchers can help by reporting colour-marked birds here.

wwrg barwit map etc

  • In Bar-tailed Godwits: Migration & Survival there is a comparison of the data generated by a catch of 505 Bar-tailed Godwits in 1976 with the information that has been generated recently, using colour-flags.
  • Bar-tailed Godwits are long-lived birds. A WWRG bird holds the current record for a BTO-ringed Bar-tailed Godwit: 33 years and 11 months between ringing in 1978 and recapture in 2008. BTO longevity records are discussed in this WaderTales blog.
  • Colour-ring reading is now a significant element of Group activities, as described by Rob Pell in the WWRG Report for 2016/2017.

Curlew

Back in the 1970s, Curlew were still hunted on the Wash (paté made from autumn-shot birds was reported to be very tasty). Shooting stopped in Great Britain in 1981, when the maximum winter count on the Wash had dropped to about 3,000 birds, and by 2003/04 the maximum winter count was 15,336. Since then, numbers have declined, in line with national and international trends.

wwrg curlew map etc

  • A large number of Curlew on the Wash in winter are from Finland and surrounding countries. Surprisingly few are of UK origin.
  • Birds wearing WWRG leg-flags have been observed breeding in the Brecks (Norfolk/Suffolk).
  • The Curlew is internationally designated as ‘Near Threatened’. Is this really true when we can still see a field with 1000 roosting Curlew in Norfolk? Answers here.

Redshank

wash redsh
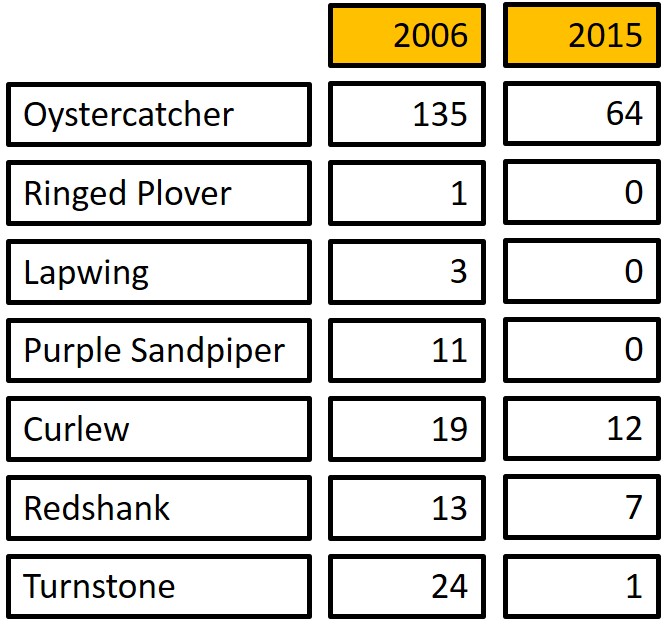
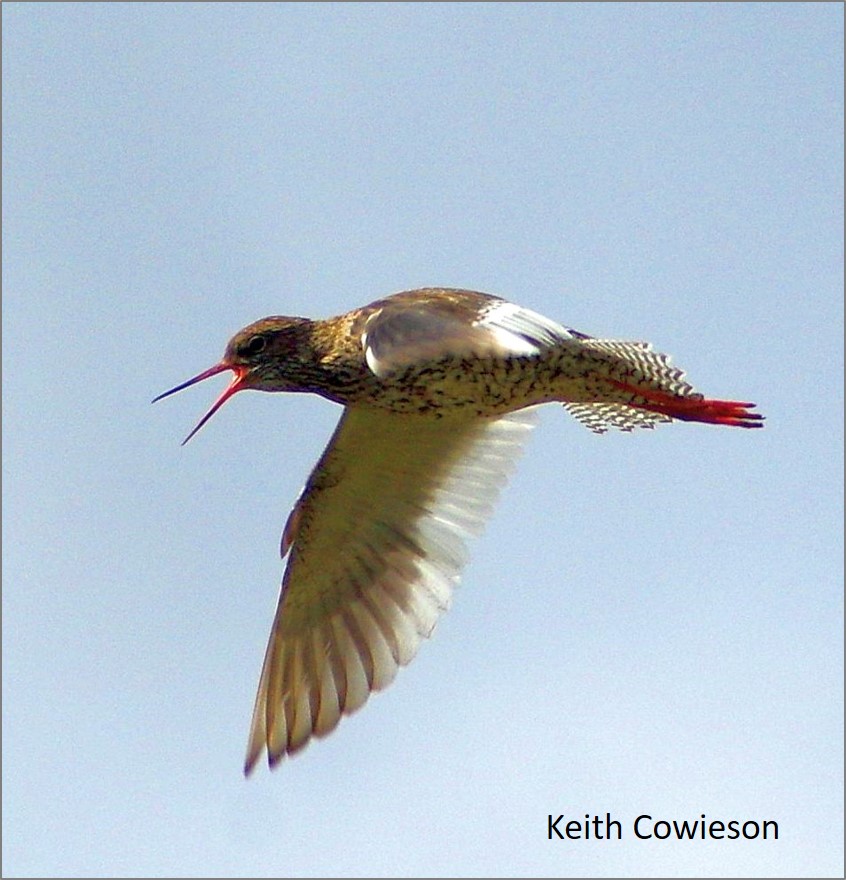
The latest population estimates suggest that Great Britain has lost 26,000 wintering Redshank in less than a decade, representing a drop of 20%. Perhaps WWRG data can be used to help to explain these declines? Here are some of the things we know:

  • The Redshank on The Wash in the winter are mainly a mixture of birds from around the Wash, across the UK and from Iceland.
  • In cold winters, Redshank wintering on the Wash die in large numbers. After a period of severe weather in 1991, nearly 3,000 wader corpses were collected from along the tide-line, about 50% of which were Redshank. The winter WeBS counts for Redshank dropped by 50% after this mortality event but have recovered somewhat since then.
  • An analysis of nearly 1,000 dead Redshank showed that about two-thirds were of Icelandic origin. There was a tendency for smaller birds to be more susceptible to cold weather mortality than larger birds of the same species (More information in this paper by Jacquie Clark)

wwrg map RK TT

Turnstone

wash tt
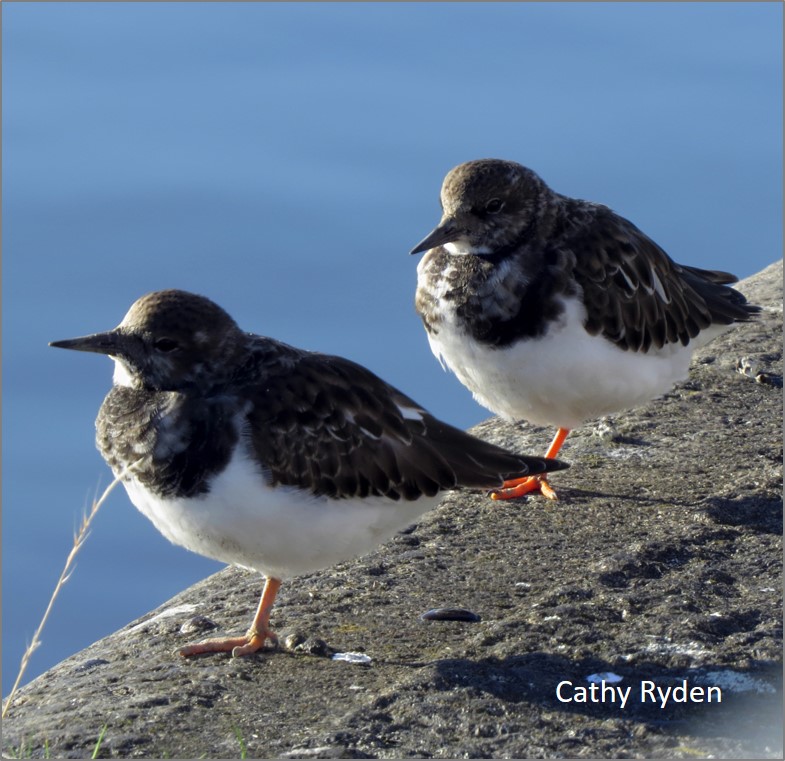
Winter Turnstone are birds that will head for Greenland and NE Canada in the spring but recoveries of birds in Finland and other Scandinavian countries indicate a passage of continental birds. African recoveries of WWRG-ringed birds probably include birds from Canada/Greenland and Finland/Scandinavia.

  • Turnstone wearing US Fish & Wildlife Service rings are occasionally caught on the Wash. Some of these rings were put on by Guy Morrison and his colleagues in Alert, Ellesmere Island, Canada. Guy was an early member of WWRG. It’s a small world!
  • The first Wash Turnstone were colour-ringed in 1999, as part of a study to understand why birds were feeding on the docks at Sutton Bridge. There is a WaderTales blog about the resulting paper by Jen Smart and Jennifer Gill. Colour-ringing continues, to measure annual survival rates.
  • Turnstone have a reputation for eating almost anything (including dog excrement and a human corpse) so do not be surprised if you see a colour-ringed bird scavenging for chips on the Hunstanton sea-front.

A few more highlights

Ringed Plover: this is not one of the ten key study species but 1,432 have been ringed between 1959 and 2018. Some birds are local breeders that hardly move anywhere but other birds link the Wash with Greenland, northern Norway, Morocco and Senegal.

wwrg GKGreenshank: The Group supports a colour-ringing project that was initiated by Pete Potts, in Hampshire. More information here.

Spotted Redshank: During the period 1959 to 2018, WWRG ringed a total of 85 Spotted Redshank, representing over 20% of the total ringed in Britain and Ireland since 1909. Amazingly, sixty of these birds were ringed on the same day – 27 July 1975. There is a blog about this catch and the recent decline in the number of Spotted Redshank visiting the UK. Fewer Spotted Redshanks.

Ruff: Until its closure, WWRG members spent many a smelly night at Wisbech Sewage Farm. This was a great place to catch Ruff, Curlew Sandpipers, Green Sandpipers etc. in mist-nets. Group members wrote a paper about Ruff moult and migration.

Rares: Occasionally there are surprises! WWRG has caught one each of Stone Curlew, Pectoral Sandpiper, Broad-billed Sandpiper and Terek Sandpiper. The last bird features in this WWRG blog.

What do we know now?

Migration studies have revealed the importance of the Wash to half a million or more waders each year – birds that spend the whole winter, others that refuel in the spring and vast numbers that rely on the food supplies in the mud to provide the energy for the post-breeding moult. There’s a selection of papers that have included WWRG data here, on the Group’s web-site.

wwrg cr TT
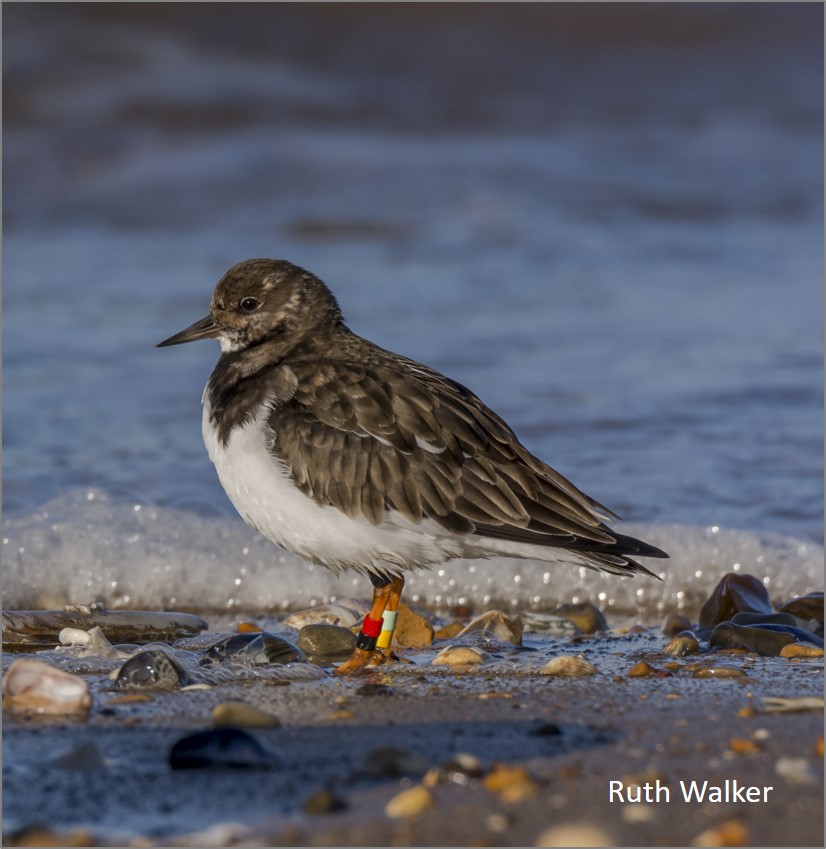
The Group still aims to maintain its general ringing programme, so that a representative sample of the key species carry rings. Colour-ringing projects aim to provide survival estimates for Curlew, Bar-tailed Godwit, Grey Plover and Turnstone, with Greenshank and Black-tailed Godwit colour-rings contributing to migration studies. Birdwatchers who visit the Wash can help by reporting colour-marked birds here, on the WWRG web-site.

WWRG data have been used to help inform decisions about the future of the Wash but the threats keep coming. Studies of migration and seasonal turn-over in numbers contributed hugely to decisions to provide national and international protection to the area and to fend off the 1970s plan to build a freshwater reservoir on the rich mudflats. The information that has been generated by many generations of volunteers over a period of sixty years has been used to manage the level of shellfish exploitation, to inform decisions about wind turbine locations and to manage activities that can cause disturbance.

The Wash Wader Ringing Group is very keen for its data to be used – and not just for impact assessment studies. Click here to learn more.

Diamond Jubilee

PLI

Phil Ireland releasing a Curlew

Over one thousand people are estimated to have contributed to sixty years of the Wash Wader Ringing Group’s activities. We have lived in barns, rolled cars, dug tens of thousands of holes, carried nets for miles, made important catches, had depressing failures, got frostbite, been threatened by surge tides and made friends for life.

In the whole of this period, there have been only two leaders of the Group – Clive Minton* (1959-1981) and Phil Ireland (1981-present). Bird ringers, wader biologists and millions of waders owe them both a huge debt of gratitude.

You can read more about the history of WWRG on the Group’s website:

*Clive Minton died in a car crash a few months after this blog was written. Friends and colleagues have shared some wonderful memories on the IWSG website.

wwrg sunset

Photo at the top of this blog is by Cathy Ryden. Many thanks to her and to other photographers.

Wee quiz:

  • Bar-tailed Godwit – Russia
  • Black-tailed Godwit – Iceland
  • Curlew – Finland
  • Oystercatcher – Norway
  • Sanderling – Greenland
  • Turnstone – Canada

GFA in Iceland

Graham (@grahamfappleton) has studied waders for over 40 years and is currently involved in wader research in the UK and in Iceland.  He was Director of Communications at The British Trust for Ornithology until 2013 and is now a freelance writer and broadcaster.

Advertisements

Occasionally, some of your visitors may see an advertisement here,
as well as a Privacy & Cookies banner at the bottom of the page.
You can hide ads completely by upgrading to one of our paid plans.

UPGRADE NOW DISMISS MESSAGE

Ireland’s wintering waders

blog KN OC

There’s still space for a few Knot

The island of Ireland is a great refuge for wintering waders, washed as it is by the warm waters of the Gulf Stream. It’s just a quick hop across the Atlantic from Iceland for Black-tailed Godwits, Golden Plovers, Redshanks and Oystercatchers. For birds travelling from Siberia, such as Dunlin and Grey Plovers, it’s a longer journey but one that’s well worth making.

If Ireland is such a great destination for shorebirds, why do the latest population estimates reveal a decline of nearly 20% in wader numbers in just five years?

This blog summarises the wader information, published in Estimates of waterbird numbers wintering in Ireland, 2011/12 – 2015/16 in Irish Birds. The totals in the report are split into counts for the Republic of Ireland and Northern Ireland but, given that waders don’t recognise borders, most of the comments in this blog relate to the whole of Ireland. The results for 2011-16 have been compared to the equivalent figures for 2006-11 and set in the context of the totals of wintering waders throughout the East Atlantic flyway, as combined by Wetlands International. The Irish data were collected by the amazing volunteers who make monthly, winter counts for I-WeBS (BirdWatch Ireland & National Parks & Wildlife Service) and WeBS (BTO/RSPB/JNCC in Northern Ireland).

blog paper

Headline figures

Fifteen species are considered in this report. The most numerous are Lapwing and Golden Plover, which account for an estimate over 170,000 individuals between them, whilst the smallest contributions are made by Purple Sandpiper (662) and Greenshank (1317). In total, the average estimated number of waders in the winters during the period 2011-16 is 429,170 birds but it should be noted that this total excludes two widespread and common species – Woodcock and Snipe – as well as the enigmatic Jack Snipe. To update previous estimates for these three species, which were last made using distribution and abundance data collected during Bird Atlas 2007-11 fieldwork, it would be necessary to run a special inland survey. There is also some question about Lapwing and Golden Plover numbers, simply because so many of these birds are found in areas that are not covered by monthly waterbird counts.

Biggest changes

blog SA

The Irish Sanderling population has increased by 13.2% in five years

The combined average winter maximum count of the 15 wader species examined in the report declined by 102,310 birds (19%) in the five-year period between 2006-11 and 2011-16. This is extremely worrying. If Lapwing and Golden Plover are excluded from consideration, as there is uncertainty about the completeness of counts, there are five species that are of particular concern; Knot numbers dropped by more than 40% and Oystercatcher, Dunlin, Redshank and Turnstone numbers by more than 20%. The Purple Sandpiper population estimate dropped by over 30% but relatively small numbers of this species are encountered around the rocky coast of Ireland. The only species to show increases were Sanderling, Bar-tailed Godwit, Black-tailed Godwit and Greenshank.

In a previous WaderTales blog, there is detailed information about population estimates for Great Britain: Do population estimates matter? In Great Britain there were similar rates of decline for Redshank and Turnstone (measured over an eight-year, rather than five-year period) but much smaller falls for Knot, Oystercatcher and Dunlin. The possible causes of the changes in Ireland are discussed in the paper in Irish Birds. They include flyway-scale declines (e.g. Knot and Curlew) and the possibility that more birds from the east are now wintering on the coasts of mainland Europe (e.g. Dunlin and Grey Plover).

blog mixed

European context

Blog table
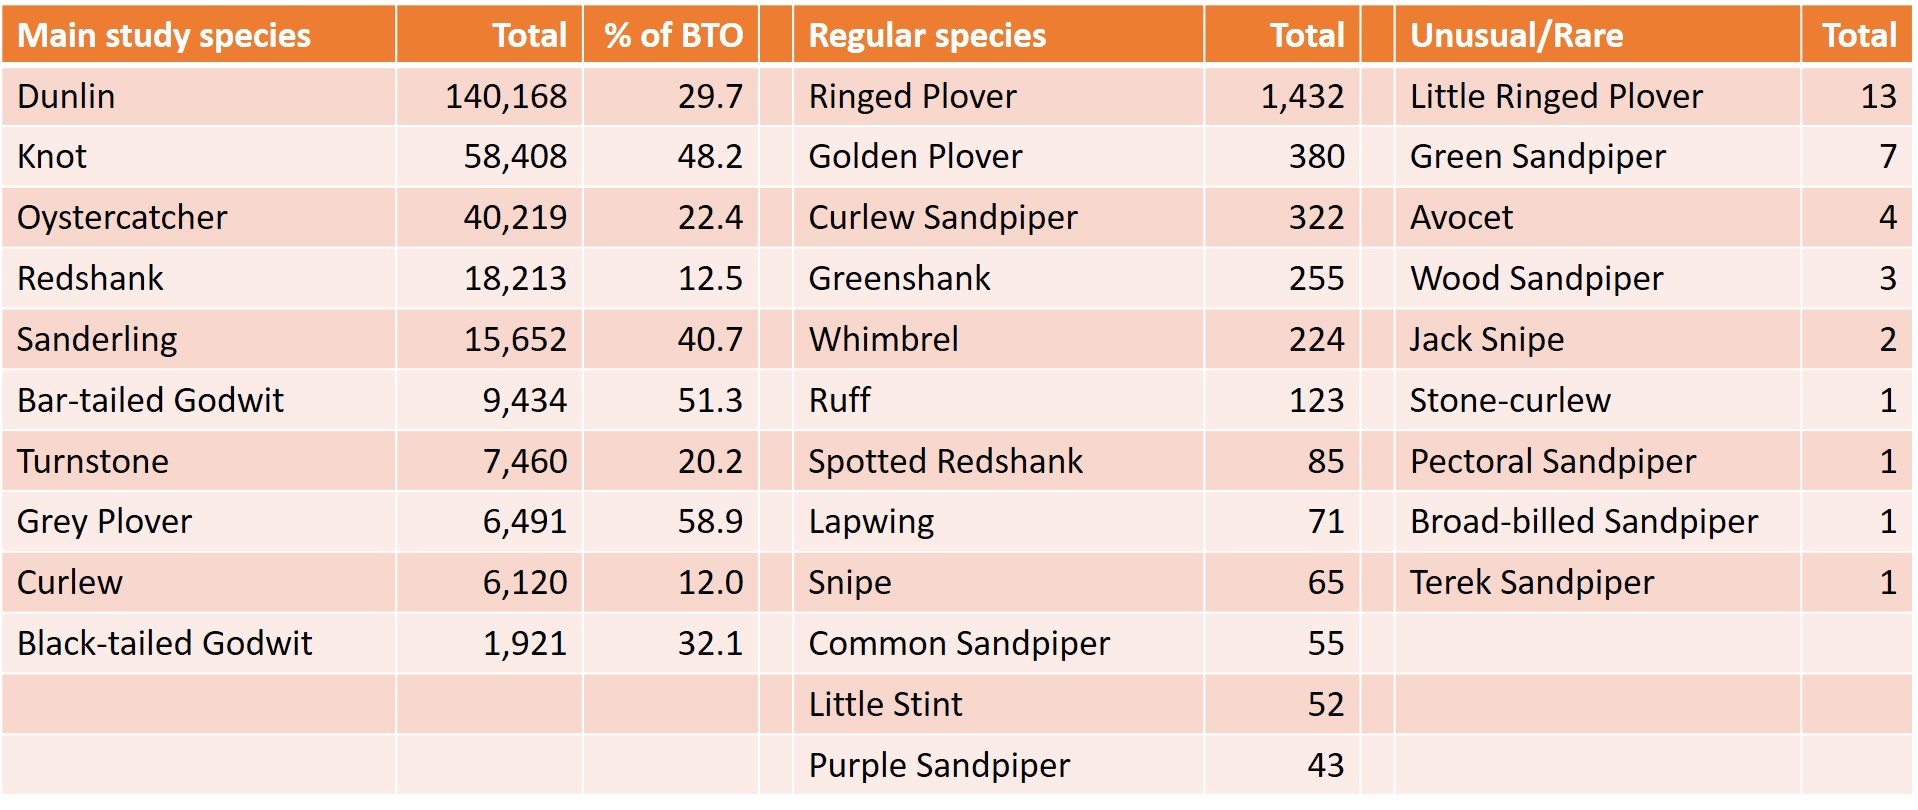
The table alongside gives an indication of the relative importance of Ireland, Great Britain and, together, the British Isles to the birds that use the East Atlantic flyway during the winter period. The three columns show the percentage of each species found in each of the three regions. Summarised international counts, as used in the paper, were kindly provided by Wetlands International. In the case of four species, Ireland is host to a significant proportion of the Icelandic breeding population (Oystercatcher, Golden Plover, Black-tailed Godwit and Redshank). There’s a WaderTales blog about the close link between Ireland & Iceland. Another blog – Which, wader, when & why? – summarises migration to, from and through Britain & Ireland.

Notes: As mentioned earlier, there are questions about the precision of estimates for Lapwing and Golden Plover, although the population trends are reliable. The Ringed Plover percentage seems high (98% for British Isles) but this may well reflect the fact that the Non-estuarine Waterbird Survey has uncovered significant numbers of the species on the open shores of Great Britain. These extra birds are included in the new totals for GB but not in the flyway total. The percentages for Black-tailed Godwit seem low, as discussed further down.

Ireland is particularly important for Golden Plover, Ringed Plover, Bar-tailed Godwit and Black-tailed Godwit, as well as for the Icelandic subspecies of Redshank. Greenshank is excluded because the percentages are below 1% of the flyway population for Ireland and for Great Britain.

blog BA horiz

11% of Bar-tailed Godwit on the East Atlantic Flyway spend the winter in Ireland

Although there are important populations of breeding waders in Ireland, the shores and wet fields of the island really come into their own during July and August, when the first ‘winter’ waders arrive, and they only become quiet again in April and May, when the last birds head north and east to nest. A successful breeder is likely only to be away for four or five months, meaning that these waders will spend by far the largest part of the year in Ireland. The island is even more important for immature birds. Young Oystercatchers that arrive from Iceland, Scotland or perhaps Norway when just a few months old are likely to spend the next 30 months in Ireland before making their first trip north. There is a WaderTales migration blog about the Oystercatchers that fly from Iceland: Migratory decisions for Icelandic Oystercatchers.

blog OC

Curlew in the Republic

Curlew numbers in the Republic of Ireland illustrate the relative importance of the country for breeding and non-breeding populations. The winter population estimate for Curlew in the Republic is 28,300 but the most recent survey conducted by BirdWatch Ireland and NPWS, as summarised in the WaderTales blog Ireland’s Curlew Crisis, reveals that the number of breeding birds has crashed to just 138 pairs. Accounting for young Irish birds that have not started to breed, and even if we assume that all Irish birds stay in the country for the winter, then the total number of home-grown Curlew seen in non-breeding flocks is at most about 400. This means that every winter flock of 70 Curlew will contain an average of just one Irish bird. Far more deliver their curl-ew calls with a Scottish, Finnish or Swedish ‘accent’. The map below shows the migration pattern for Curlew ringed in or found in Britain & Ireland.

blog migration map

Black-tailed Godwit

In the table above, it looks as if 18% of Iceland’s Black-tailed Godwits spend the winter in Ireland. This is probably an underestimate of the importance of the Republic of Ireland and Northern Ireland to the species. The flyway total for Black-tailed Godwit is given as between 98,000 and 134,000 in the Irish Birds paper and the percentage figure is based on 110,000. These three figures are almost certainly too high, as they build upon country-based estimates that have subsequently been revised. The true figure is likely to be around 60,000 to 65,000 (J. Gill pers. comm.), which would suggest that the maximum winter count in Ireland of 19,800 represents at least 30% of the islandica Black-tailed Godwits. Add in extra birds that moult in Ireland in the autumn, before moving further south to countries such as Portugal, and other birds that spend spring months on the island, and Ireland becomes even more important for Black-tailed Godwits!

blog BTMost birdwatchers might associate flocks of waders with estuaries but Black-tailed Godwit is an excellent example of a species that also relies on inland fields, either close to estuaries or along river valleys. Whilst undertaking PhD research on Black-tailed Godwits in south-east Ireland, Daniel Hayhow showed that there is insufficient time to find enough estuarine food during the mid-winter tidal cycles, with birds topping up their resources on grassland. You can read more about the energetic consequences of choosing to winter in eastern England, Portugal and Ireland in this blog: Overtaking on migration. Site designation and planning decisions need to take account of the grassland feeding requirements of Black-tailed Godwits and other waders that do not spend all of their time on estuaries, particularly Curlew.

Conservation implications

Some of the issues facing waders may be related to threats that species face in the breeding grounds. However, it may be easier to introduce measures that provide better protection and feeding opportunities in the wintering area, as ways of maintaining populations through the non-breeding season, than it is to deal with problems in the High Arctic. (Although we can all help by reducing carbon emissions, in order to minimise global warming, of course).

blog OC SA

Reading the report, I was reminded of the need to consider a range of conservation issues:

  • Care needs to be taken when considering shoreline developments. These can directly remove habitat or squeeze the width of the intertidal zone.
  • Increased harvesting of shellfish can affect species such as Oystercatcher and Knot and brings risks of introducing alien species and diseases.
  • In the drive to cut carbon emissions, tidal, wave and wind power developments need to be sited in appropriate places.
  • Off-shore harvesting of growing kelp beds has been suggested, as a way of producing fertiliser and biofuels. This process could reduce protection for beaches and change the availability of resources for species such as Turnstone and Sanderling.
  • Grassland areas need to be considered (and not just estuaries) when planning protection for species such as Curlew and Black-tailed Godwit.

blog RKPaper

Estimates of waterbird numbers wintering in Ireland, 2011/12 – 2015/16. Brian Burke, Lesley J. Lewis, Niamh Fitzgerald, Teresa Frost, Graham Austin, and T. David Tierney. Irish Birds No. 41, 1-12.

There is a complementary paper in British Birds, covering Great Britain. The wader information is summarised in this blog: Do population estimates matter?


GFA in Iceland

WaderTales blogs are written by Graham Appleton, to celebrate waders and wader research.  Many of the articles are based on previously published papers, with the aim of making wader science available to a broader audience.

@grahamfappleton

Do population estimates matter?

blog top godwitsHow many waders spend the winter in Great Britain? The answer is provided within an article in British Birds entitled Population estimates of wintering waterbirds in Great Britain. It includes all the wader species from Little Stint to Curlew that are covered by the Wetland Bird Survey  This survey is based on monthly counts that take place at about 2000 wetlands and coastal sites. The main aim is to monitor the rise and falls in numbers over time.

Please note that Northern Ireland WeBS figures are included in a separate blog covering the island of Ireland that was published in Irish Birds.

Why do we need to know the total number of birds in Great Britain?

  • If we count the number of Curlew and we have a figure for the European population then we know that Great Britain is responsible for nearly 20% of Europe’s Curlew each winter, thereby strengthening the case for national conservation action;
  • If we have a national figure, then we know that a flock of 2000 Black-tailed Godwit represents (as it turns out) over 5% of the British total, which is a useful criterion when assessing the conservation importance of individual sites;
  • blog GKPopulation totals help to put annual percentage changes into context;
  • And simply because people ask questions such as “how many Greenshank are there in the country during the winter?”

So, here’s the bottom line. In their 2019 review of waterbird numbers in British Birds, a team from BTO, WWT, JNCC & RSPB reveal that an estimated total of 4.9 million waders spend the winter in Great Britain. For several species, GB holds a third or more of the East Atlantic Flyway population!

Making the counts

The population estimates owe a lot to those who undertake monthly Wetland Bird Survey (WeBS) counts on estuaries, lakes and waterways, during the winter months, year in and year out. Counts from the period 2012/13 to 2016/17 are used in the population estimates that form the basis for the 2019 review. WeBS data have many other uses, as you can read here: Wetland Bird Survey: working for waders.

blog CUFor species of wader that also make use of the open coast, the Non-estuarine Waterbirds Survey of 2015/16 (or NEWS III) provided additional data, updating the NEWS II figures from 2006/07.

The vast majority of our wintering Purple Sandpipers are found on open beaches and rocky shores, as well as large numbers of Turnstone, Ringed Plover and Sanderling, together with significant numbers of Oystercatcher, Curlew and Redshank. There’s more about NEWS in this slightly dated blog: NEWS and Oystercatchers for Christmas.

The last assessment of winter wader populations was made by the Avian Population Estimates Panel and published in British Birds in 2013 as Population estimates of birds in Great Britain and the United Kingdom (APEP3). In here, estimates for waders were largely based on WeBS data for the period 2004-09 and NEWS II. The new assessment is presented as Population estimates of wintering waterbirds in Great Britain and also published in British Birds. It uses WeBS information for the period 2012-17 and NEWS III data. Effectively, there is an 8-year or 9-year difference between the two sets of figures.

The biggest losers

blog graphicGreat Britain is extremely important in the context of the East Atlantic Flyway, as is obvious from the fact that the area holds nearly five million waders. The WeBs counts already monitor the ups and downs on an annual basis but this review provides an opportunity to turn the percentages into actual numbers. It is concerning that, over a period representing less than a decade, the average maximum winter count for six of the species that were surveyed dropped by a total of over 150,000. These big losers were Knot, Oystercatcher, Redshank, Curlew, Grey Plover and Dunlin, ordered by number of birds lost, with Knot seeing the biggest absolute decline.

In preparing the new estimates for the British Birds paper, an opportunity was taken to refine the way that populations are calculated, based on Use of environmental stratification to derive non-breeding population estimates of dispersed waterbirds in Great Britain, by Verónica Méndez et al. The new methodology explains some of the differences between percentage changes reported by WeBS and the percentage changes obtained by comparing the latest population estimates to those in APEP3.

blog KN graphic

The Knot estimate dropped from 320,000 to 260,000. This decline is bigger than might be expected from the counts that take place at sites covered by WeBS, being larger than the ten-year decline of 14% reported in the last WeBS report. Knot are mobile species within the North Sea and Atlantic Coast wintering area and it is possible that British losses may be explained, at least to some extent, by redistribution.

blog oyc graph
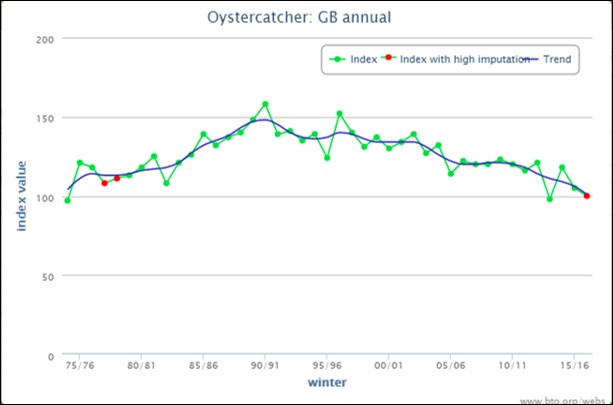
The drop in Oystercatcher numbers from 320,000 to 290,000 appears to be less than 10%, compared to a ten-year decline of 12% on WeBS. Improved analysis of NEWS data helped to add some more birds to the open-coast estimate so the 10% fall may underestimate the seriousness of the Oystercatcher situation. The 25-year Oystercatcher decline on WeBS is 26%, which is not surprising if you look at the changes to breeding numbers in Scotland, where most British birds are to be found. There’s more about this in: From shingle beach to roof-top.

blog RKThe Redshank decline of 26,000 is higher than would be predicted from WeBS figures, suggesting a drop of over 20% since APEP3, rather than ‘just’ 15% for the ten-year WeBS figure. This is a species that also features strongly in the Non-estuarine Waterbird Survey and that might explain the difference. Wintering Redshank are mostly of British and Icelandic origin, with the Breeding Bird Survey (BBS) suggesting a ten-year decline of 24% in our British breeding birds.

The Curlew is now globally recognised as near-threatened. The latest winter estimate is 120,000, down from 140,000 in APEP3. The new total represents between 14% and 19% of the European population, which means that we have a particular responsibility for this much-loved species. Only the Netherlands holds more wintering Curlew than Great Britain. Is the Curlew really nearly-threatened? is one of several blogs about Curlew in the WaderTales catalogue at www.wadertales.wordpress/about .

blog 2 DNIt has been suggested that the long-term declines of Grey Plover and Dunlin  may be associated with short-stopping, with new generations of both species wintering closer to their eastern breeding grounds than used to be the case. WeBS results indicate a 31% drop in Grey Plover and a 42% drop in Dunlin, over the last 25 years. There was a loss of 10,000 for both species between APEP3 and the new review, representing declines of 23% and 3% respectively.

The biggest winners

There are several big winners in the period between APEP3 (2004-09) and the new review (2012-16), although, in some cases, not all is as it seems.

The Avocet has seen further dramatic gains. with the estimated wintering population rising to 8,700. The increase is not quite as big as might have been expected, based on the 43% rise seen in ten years of WeBS counts, but it is still a dramatic continuation of a 40-year trend.

The numbers of Bar-tailed Godwit and Ringed Plover are both substantially higher but at least a proportion of each of these changes is linked to the better coverage and more sophisticated sampling methods that were discussed earlier. Bar-tailed Godwit increases may also reflect redistribution around the North Sea.

blog BW graphOne of the consequences of improved statistical techniques, as used this time around, is the apparent decline in the estimated population of Black-tailed Godwit. The new figure of 39,000 is 4,000 smaller than in APEP3, despite the fact that the WeBS graph clearly shows an increase. Interpolation using WeBs figures suggests that the earlier population estimate should have been 31,000, rather than 43,000.

Sanderling from Greenland spend the non-breeding season as far south as South Africa but  increasing numbers of birds are wintering in Great Britain and Ireland (25% increase in 8 years in GB and 13% in 5 years in Ireland). Interestingly, survival rates of English birds are just as high as those in Namibia. The losers are birds that spend the non-breeding season in equatorial Africa, as you can read here; Travel advice for Sanderling.

There are other winners too, as you can read in the paper. At the start, I posed the question “how many Greenshank are there in the country during the winter?”.  The answer is 810, representing an increase of 200 since APEP3. The vast majority of these wintering Greenshank are birds from the population that breeds in northern Scotland, as you can read in Migration of Scottish Greenshank.

Game species

The estimates for the three wintering waders that are still on the UK quarry list have not changed since APEP3 (published in 2011) as there are no new data available.

Golden Plover: The winter estimate remains as 400,000, as there has been no comprehensive, winter survey since 2006/7. Large numbers of Golden Plover arrive from Scandinavia, Europe and Iceland in the late summer, joining the British birds that choose not to migrate south or west. The GB breeding population is probably less than 50,000 pairs. Most breed in Scotland which has seen a breeding decline of 5% in the period 1995 to 2018 (BBS). Golden Plover is still ‘green listed’.

snipe-headerSnipe (Common): The winter estimate remains as 1,100,000 – a figure that was acknowledged in APEP3 as being less reliable than that of most species. At the same time, the GB breeding population was estimated as 76,000 pairs, indicating at least a 4:1 ratio of foreign to British birds, and that does not take account of the number of British birds that migrate south and west. Snipe are ‘amber listed’ but BBS suggests a recent increase of 26% (1995-2018). There is a WaderTales blog about  Snipe and Jack Snipe.

Woodcock: The winter estimate remains as 1,400,000 – another figure that is not considered to be particularly precise, with much variation between years. The diminishing breeding population is dwarfed by winter numbers, as you can read in this WaderTales blog, with increased attention being given to ways to afford better protection of red-listed, British-breeding birds.

Many of the Golden Plover, Snipe and Woodcock that spend winter in Great Britain are birds that breed in Fennoscandia (Finland, Sweden & Norway). The latest assessment of breeding numbers shows that populations of all three species are stable. See Fennoscandian Wader Factory.

January counts

blog BTThe paper in British Birds also includes a table of January population estimates, to provide data that are comparable to mid-winter counts in other countries. These figures are used in waterbird monitoring for the International Waterbird Census for the African Eurasian Flyway. The main table (and figures mentioned above) are average maximum winter counts (in the period September to March). Black-tailed Godwit is one species that illustrates the difference, with a mean of 30,000 in January and a mean peak count of 39,000. Having moulted in Great Britain, some Black-tailed Godwits move south to France and Portugal in late autumn, returning as early as February. January counts are therefore substantially lower than early-winter and late-winter counts. There is more about the migratory strategy employed by Black-tailed Godwits that winter in southern Europe in Overtaking on Migration.

Looking forward

blog BB coverThe authors have done a tremendous job. They have refined the way that estimates are calculated, they have combined the results from WeBS and NEWS III, and they have delivered population estimates for 25 wader species and many more other species of waterbirds. These population estimates will be used in conservation decision-making until the next set of numbers becomes available. Meanwhile, thousands of birdwatchers will count the birds on their WeBS patches in each winter month, every year. Without them, this paper could not have been written.

Before the next assessment, there will need to be another NEWS survey, to check up on species that use rocky and sandy shore birds, such as Purple Sandpipers, Turnstone and Curlew. Hopefully, there will also be a dedicated survey to assess Lapwing and Golden Plover numbers and perhaps we might find a way to refine the old estimates for Woodcock, Snipe and Jack Snipe.

Paper

Population estimates of wintering waterbirds in Great Britain. Teresa Frost, Graham Austin, Richard Hearn, Stephen McAvoy, Anna Robinson, David Stroud, Ian Woodward and Simon Wotton. Published in British Birds Volume 112. March 2019.

blog flying godwits


GFA in Iceland

WaderTales blogs are written by Graham Appleton, to celebrate waders and wader research.  Many of the articles are based on previously published papers, with the aim of making wader science available to a broader audience.

@grahamfappleton