Iceland’s waders need a strategic forestry plan

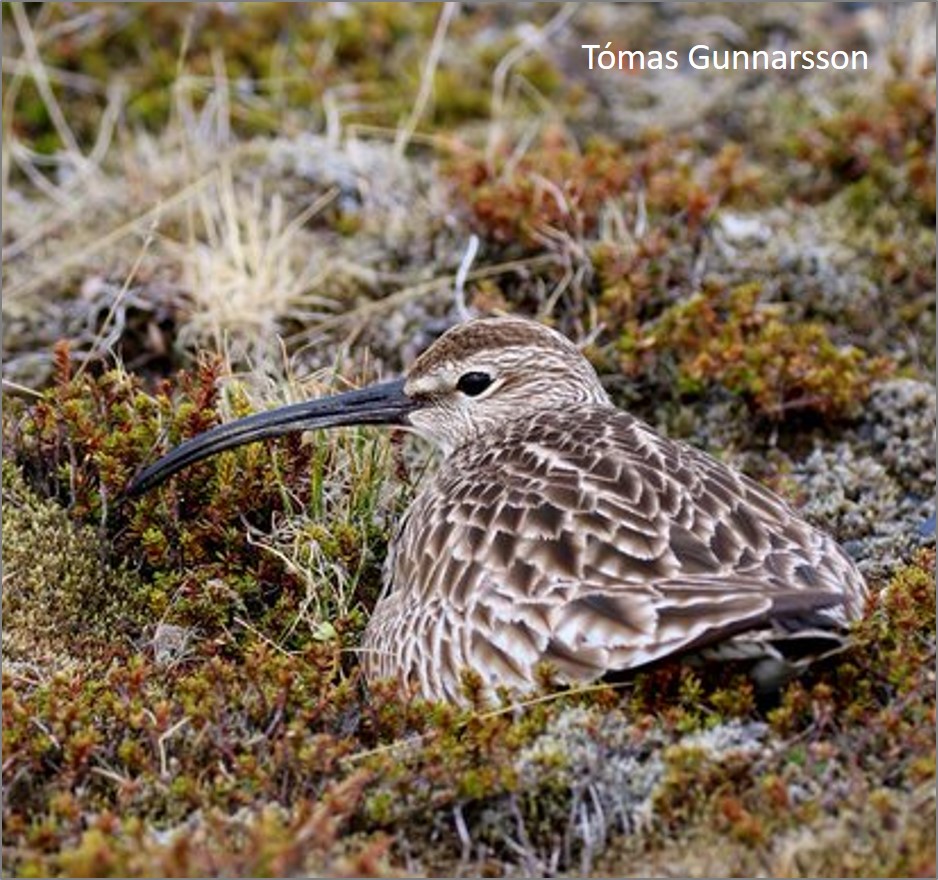
More and more trees are being planted in lowland Iceland – and further increases are planned, in part encouraged by the suggestion that this will mitigate for climate change. Forestry is potentially bad news for Whimbrel, Black-tailed Godwit and other waders that breed in open habitats, and which migrate south to Europe and Africa each autumn. Are there ways to accommodate trees while reducing the damage to internationally important populations of waders?

Pressure on Iceland’s breeding waders

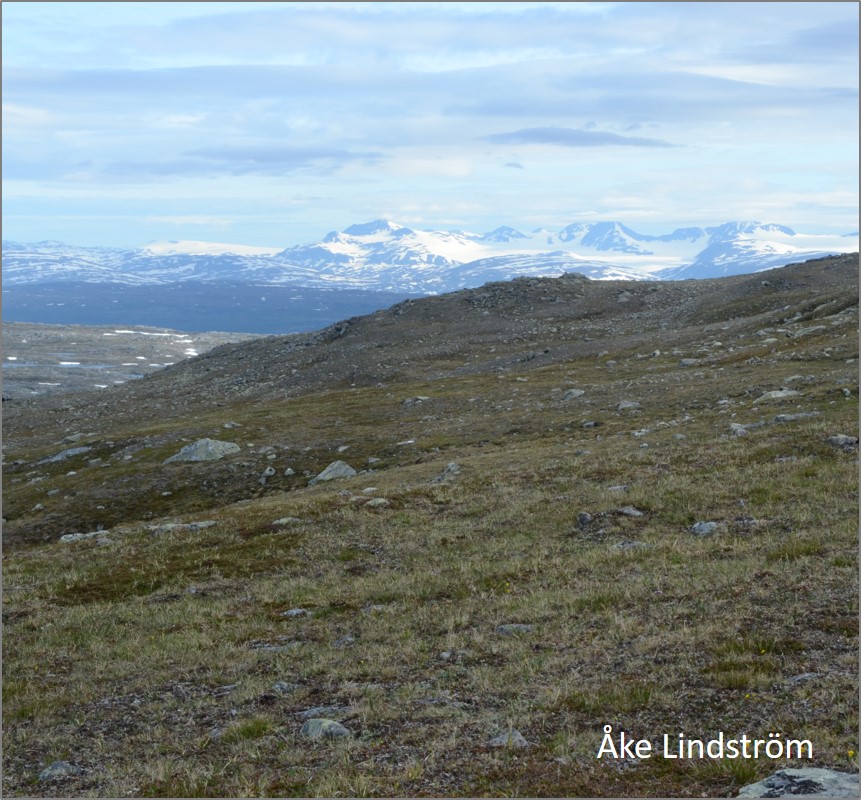
Iceland is changing; more people want second homes in the countryside, the road network is being developed to cope with more and more tourists, new infrastructure is needed to distribute electricity, agriculture is becoming more intensive and there is a push to plant lots more trees. The south of the country is seeing the most rapid loss of open spaces, providing opportunities to study how these incursions affect ground-nesting species, particularly breeding waders.

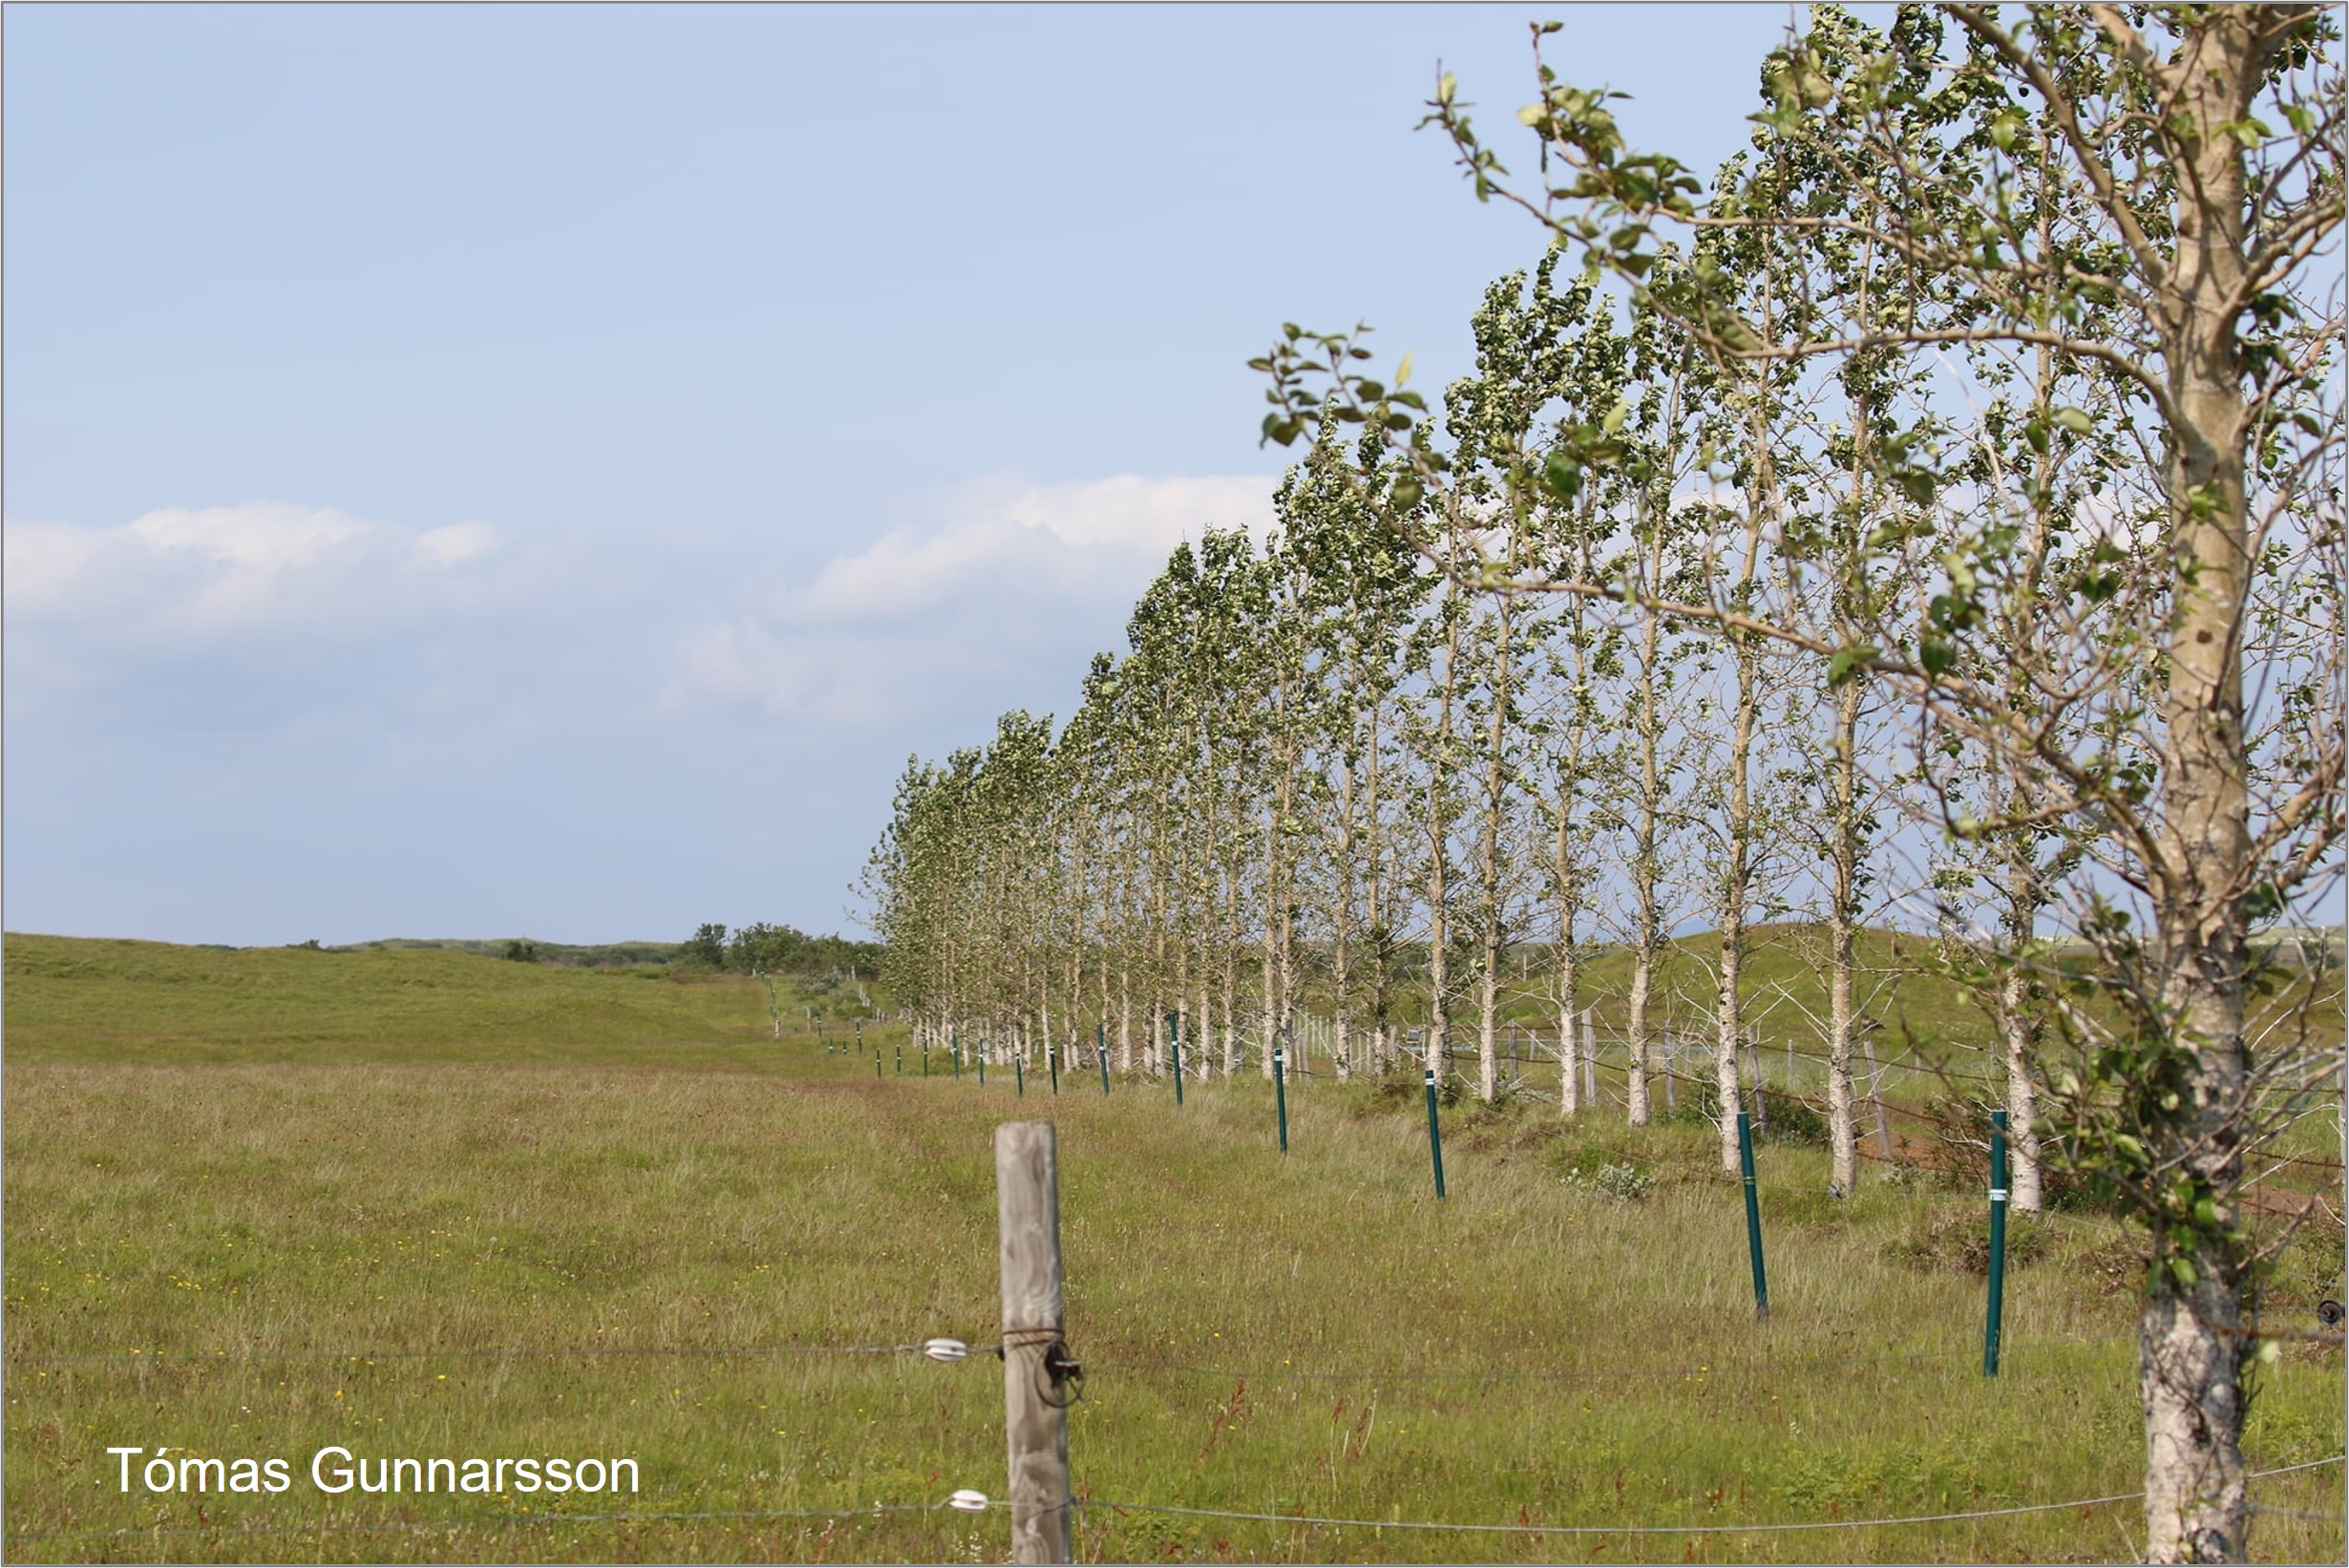
One of the big changes, especially in Southern Iceland, has been the planting of non-native trees, as shelter belts around fields and country cottages and, more significantly, as commercial crops. Iceland has been largely treeless for hundreds of years but climatic amelioration has facilitated rapid forestry development in areas where tree growth was previously limited by harsher environmental conditions. Seeds of some non-native species are blown on the wind for a kilometre or more, to germinate in open land, well beyond the edge of planned forests.

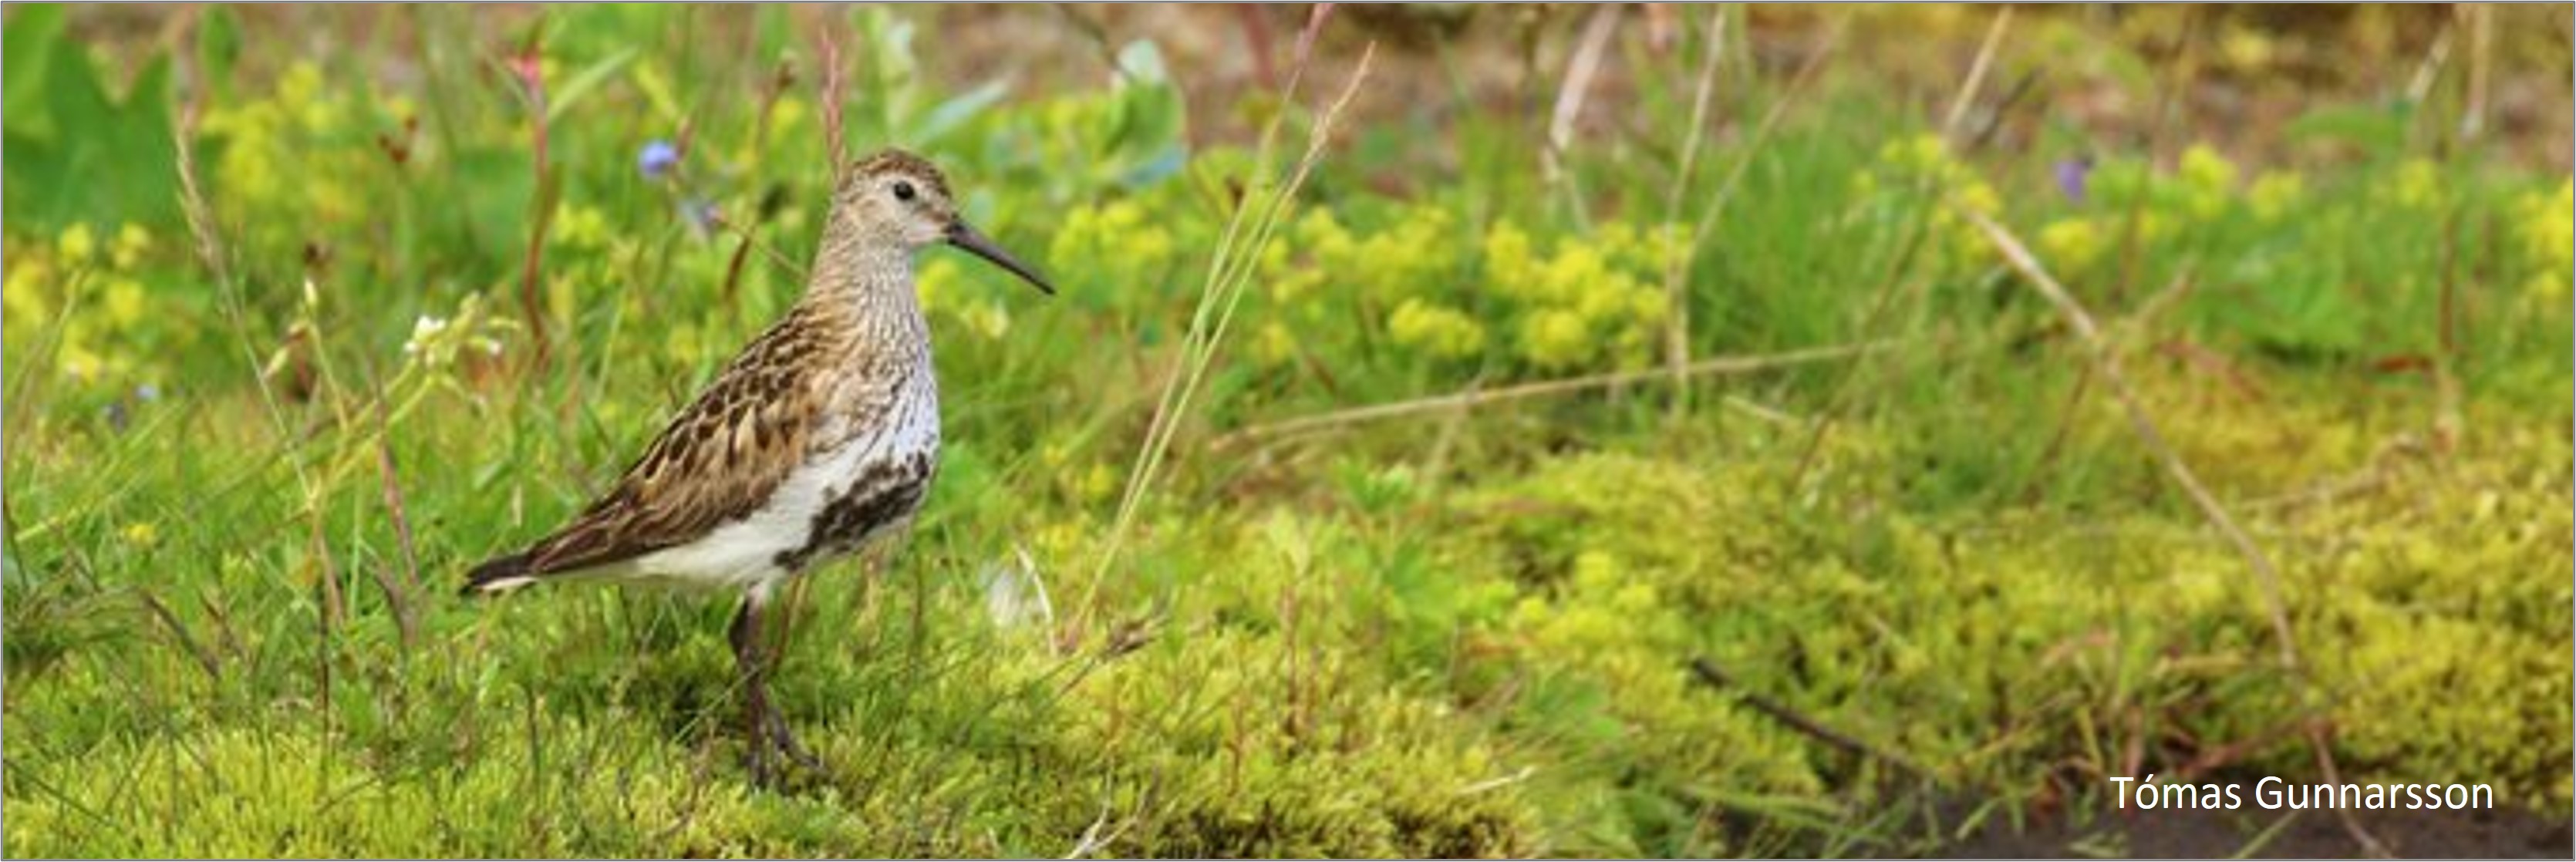
Most of the new forests are in lowland areas, where we also find the most important habitats for many ground-nesting bird populations. Lodgepole pines may be good news for Goldcrest and Crossbills but not for species such as Golden Plover, Dunlin & Redshank. For breeding waders, the most obvious impact of a new forest is direct loss of breeding habitat but trees can have wider effects, by providing cover for predators and breaking up swathes of open land that are used at different stages of the breeding season. Little is currently known about how predators in Iceland use forest plantations but any perceived risks of predator presence and reduced visibility is likely to influence densities of birds in the surrounding area.

Iceland’s open habitats have suited breeding waders for hundreds of years

Aldís E. Pálsdóttir’s studied changing bird populations in lowland Iceland during her PhD at the University of Iceland, in collaboration with researchers from the University of East Anglia (UK) and the University of Aveiro (Portugal). Among the most concerning of these changes is the rapid expansion of forestry in these open landscapes.

Assessing the potential impacts of trees

In a 2022 paper in the Journal of Applied Ecology, Aldís assesses whether densities of ground-nesting birds are lower in the landscape surrounding plantations and whether these effects vary among plantations with differing characteristics. She and her fellow authors then quantified the potential impact of differing future afforestation scenarios on waders nesting in lowland Iceland.

Forestry currently covers about 2% of Iceland’s land area so the potential for growth is massive. In 2018, the Icelandic government provided additional funding to the Icelandic forest service to increase the number of trees planted, with a goal of enhancing carbon sequestration. As forestry primarily operates through government grants to private landowners, who plant trees within their own land holdings, plantations typically occur as numerous relatively small patches in otherwise open landscapes. These features make Iceland an ideal location in which to quantify the way that plantations affect densities of birds in the surrounding habitats, and to identify afforestation strategies that might reduce impacts on globally important wader populations.

To measure the effects of plantation forests on the abundance and distribution of ground-nesting birds, in particular waders, 161 transect surveys were conducted between May and June 2017. To avoid systematic bias arising from possible “push effects” of corralling birds in front of the surveyor, surveys were conducted along transects that started either at the edge of the plantation, with the observer moving away (79 transects), or started away from the plantation, with the observer walking towards it (82 transects). Please see the paper for the full methodology. The variation in density with distance from plantation was used to estimate the likely changes in bird numbers, resulting from future afforestation plans, and to explore the potential effects of different planting scenarios.

Bird communities change around plantations

Snipe densities are highest close to young forests

On the transects, 3713 individual birds of 30 species were recorded. The nine most common species (excluding gulls, which rarely breed in the focal habitats) were seven waders (Oystercatcher, Golden Plover, Dunlin, Common Snipe, Whimbrel, Black-tailed Godwit & Redshank) and two passerines (Meadow Pipit & Redwing). These species accounted for 88% of all birds recorded.

  • Of the seven waders, Snipe was the only one found in significantly higher numbers closer to plantations. Snipe density declined by approximately 50% between the first (0-50 m) and second (50-100 m) distance intervals, suggesting a highly localised positive effect of plantations on Snipe densities.
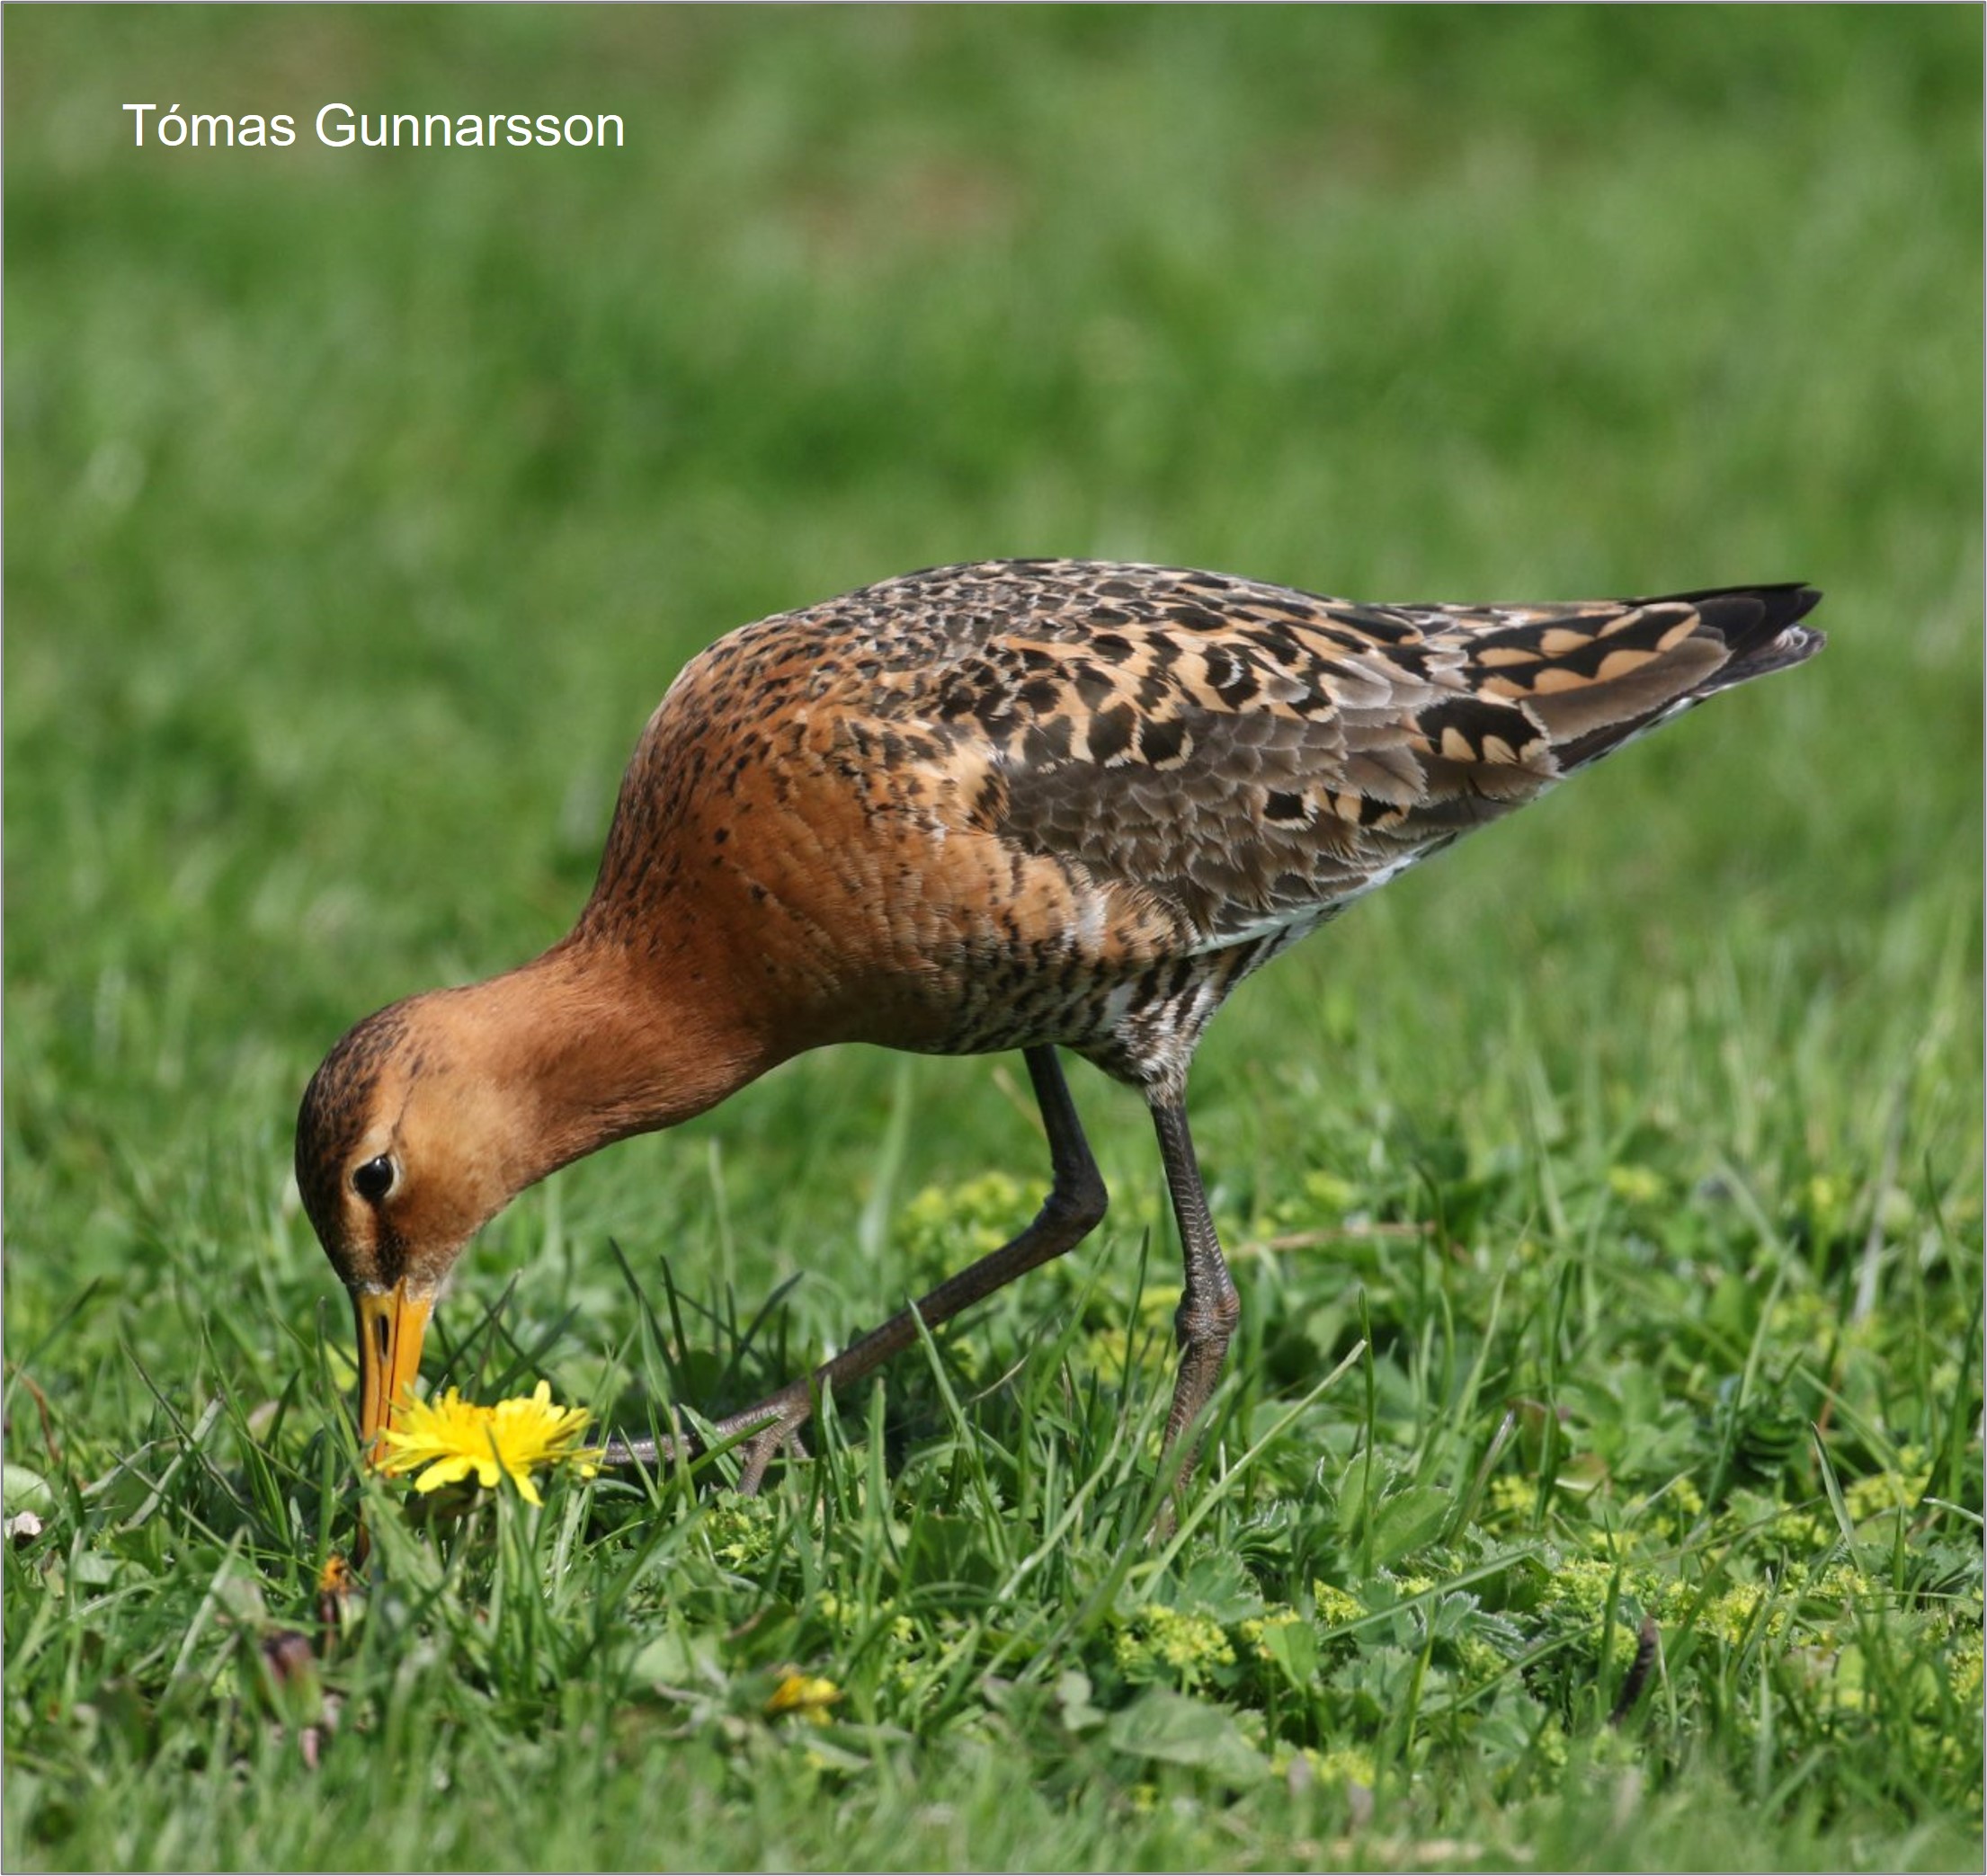
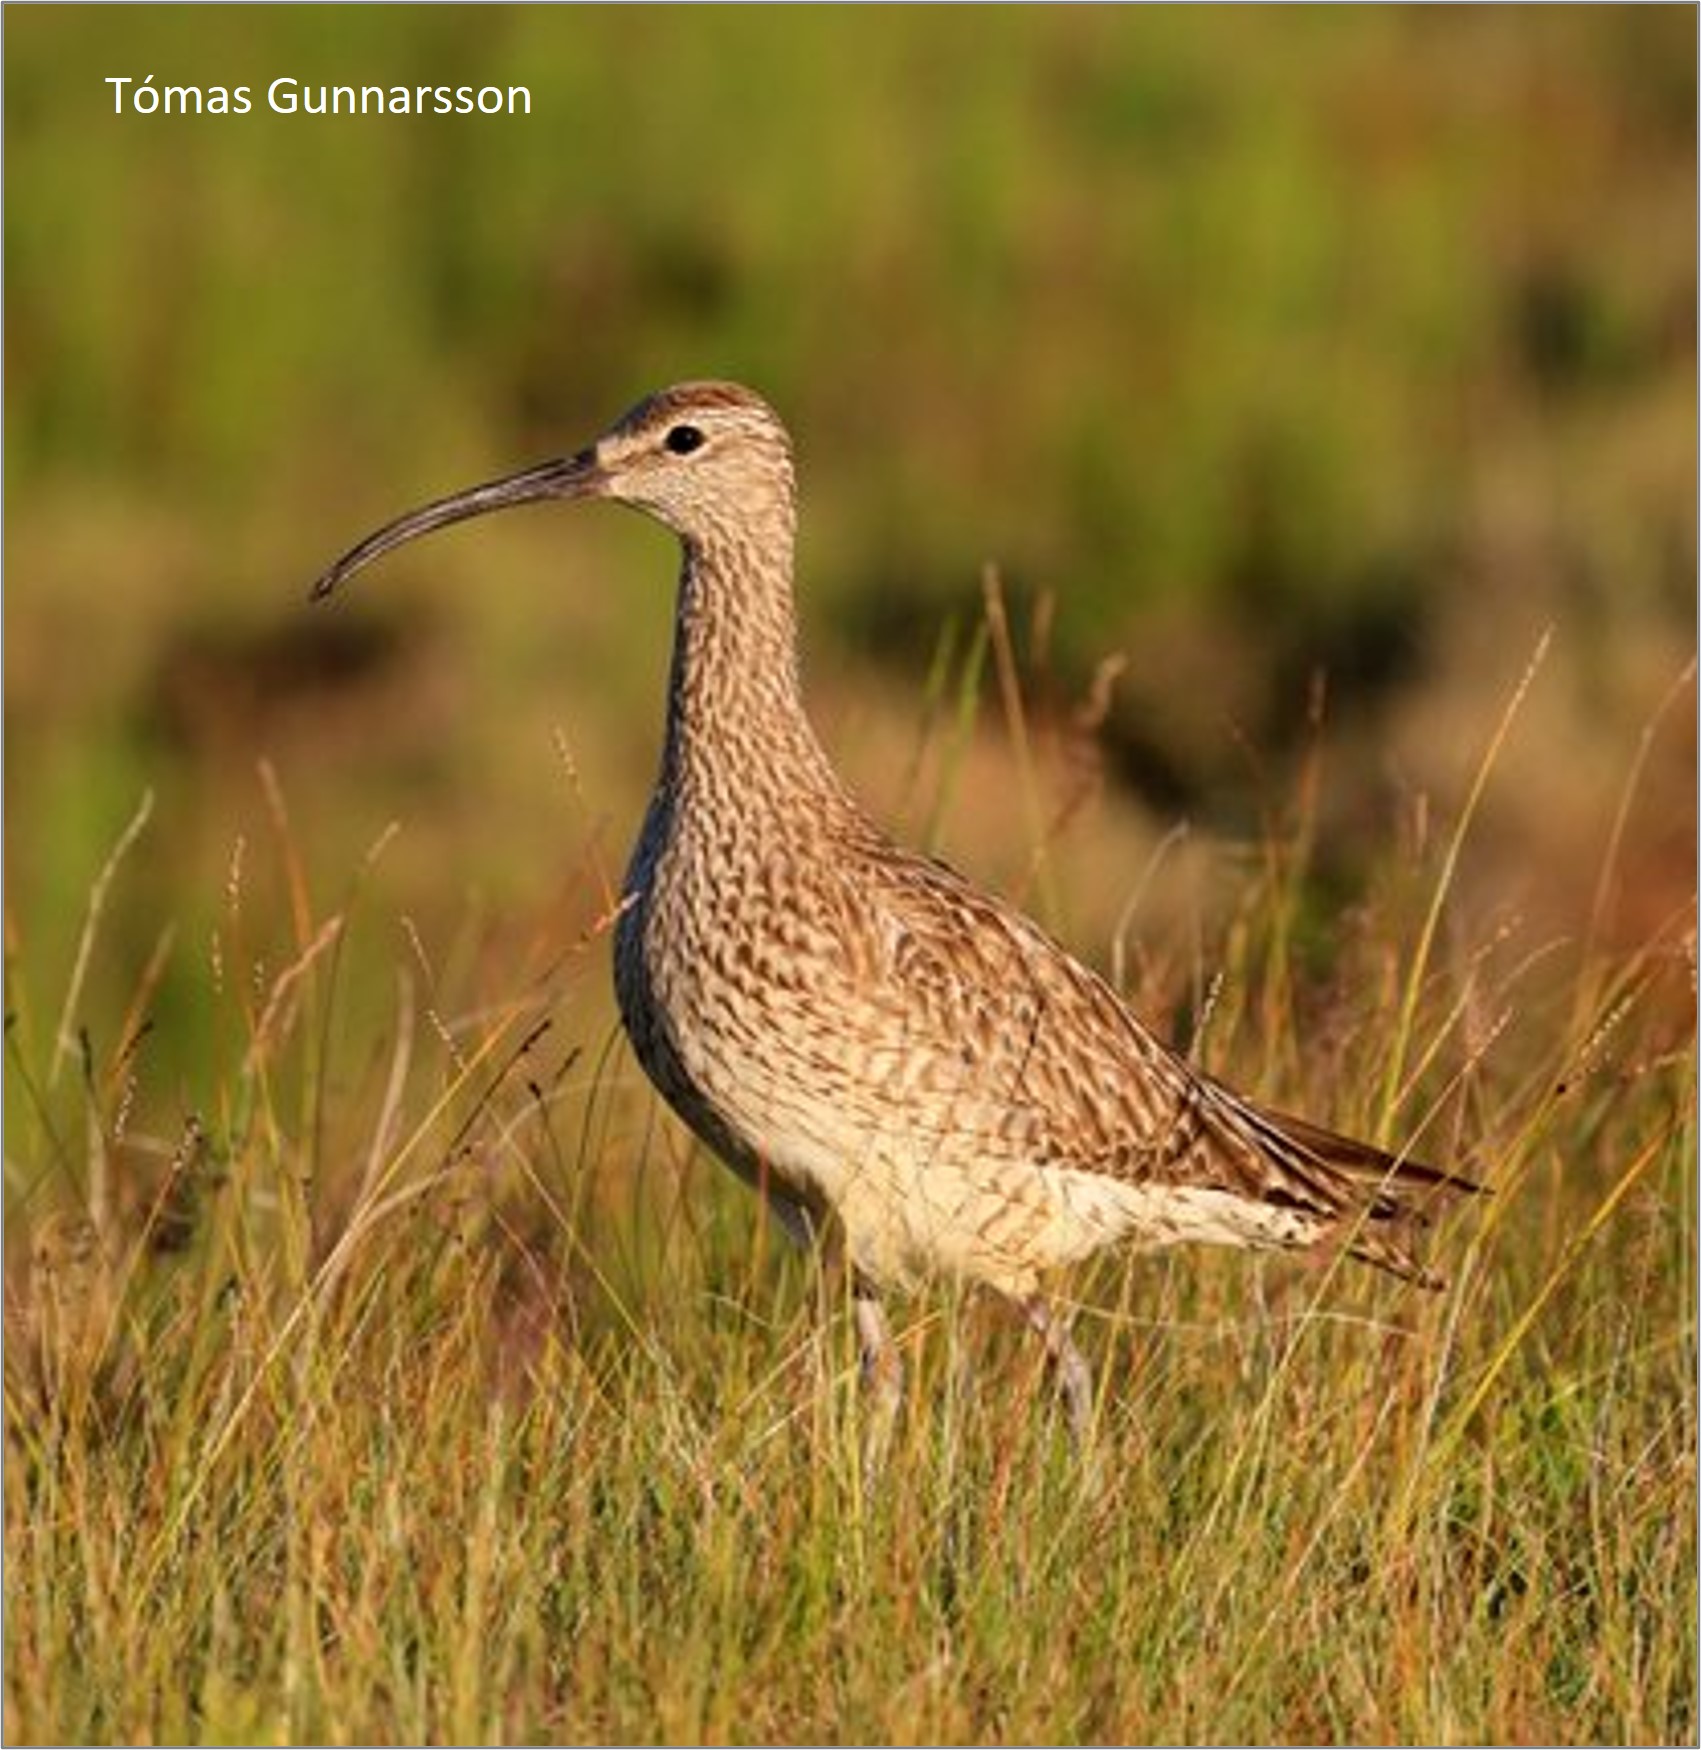
  • Densities of Golden Plover, Whimbrel, Oystercatcher, Dunlin and Black-tailed Godwit all increased significantly with increasing distance from plantations. Dunlin and Oystercatcher showed the largest effect (~15% increase per 50 m), followed by Whimbrel (~12%), Black-tailed Godwit (~7%) and Golden plover (~4%).
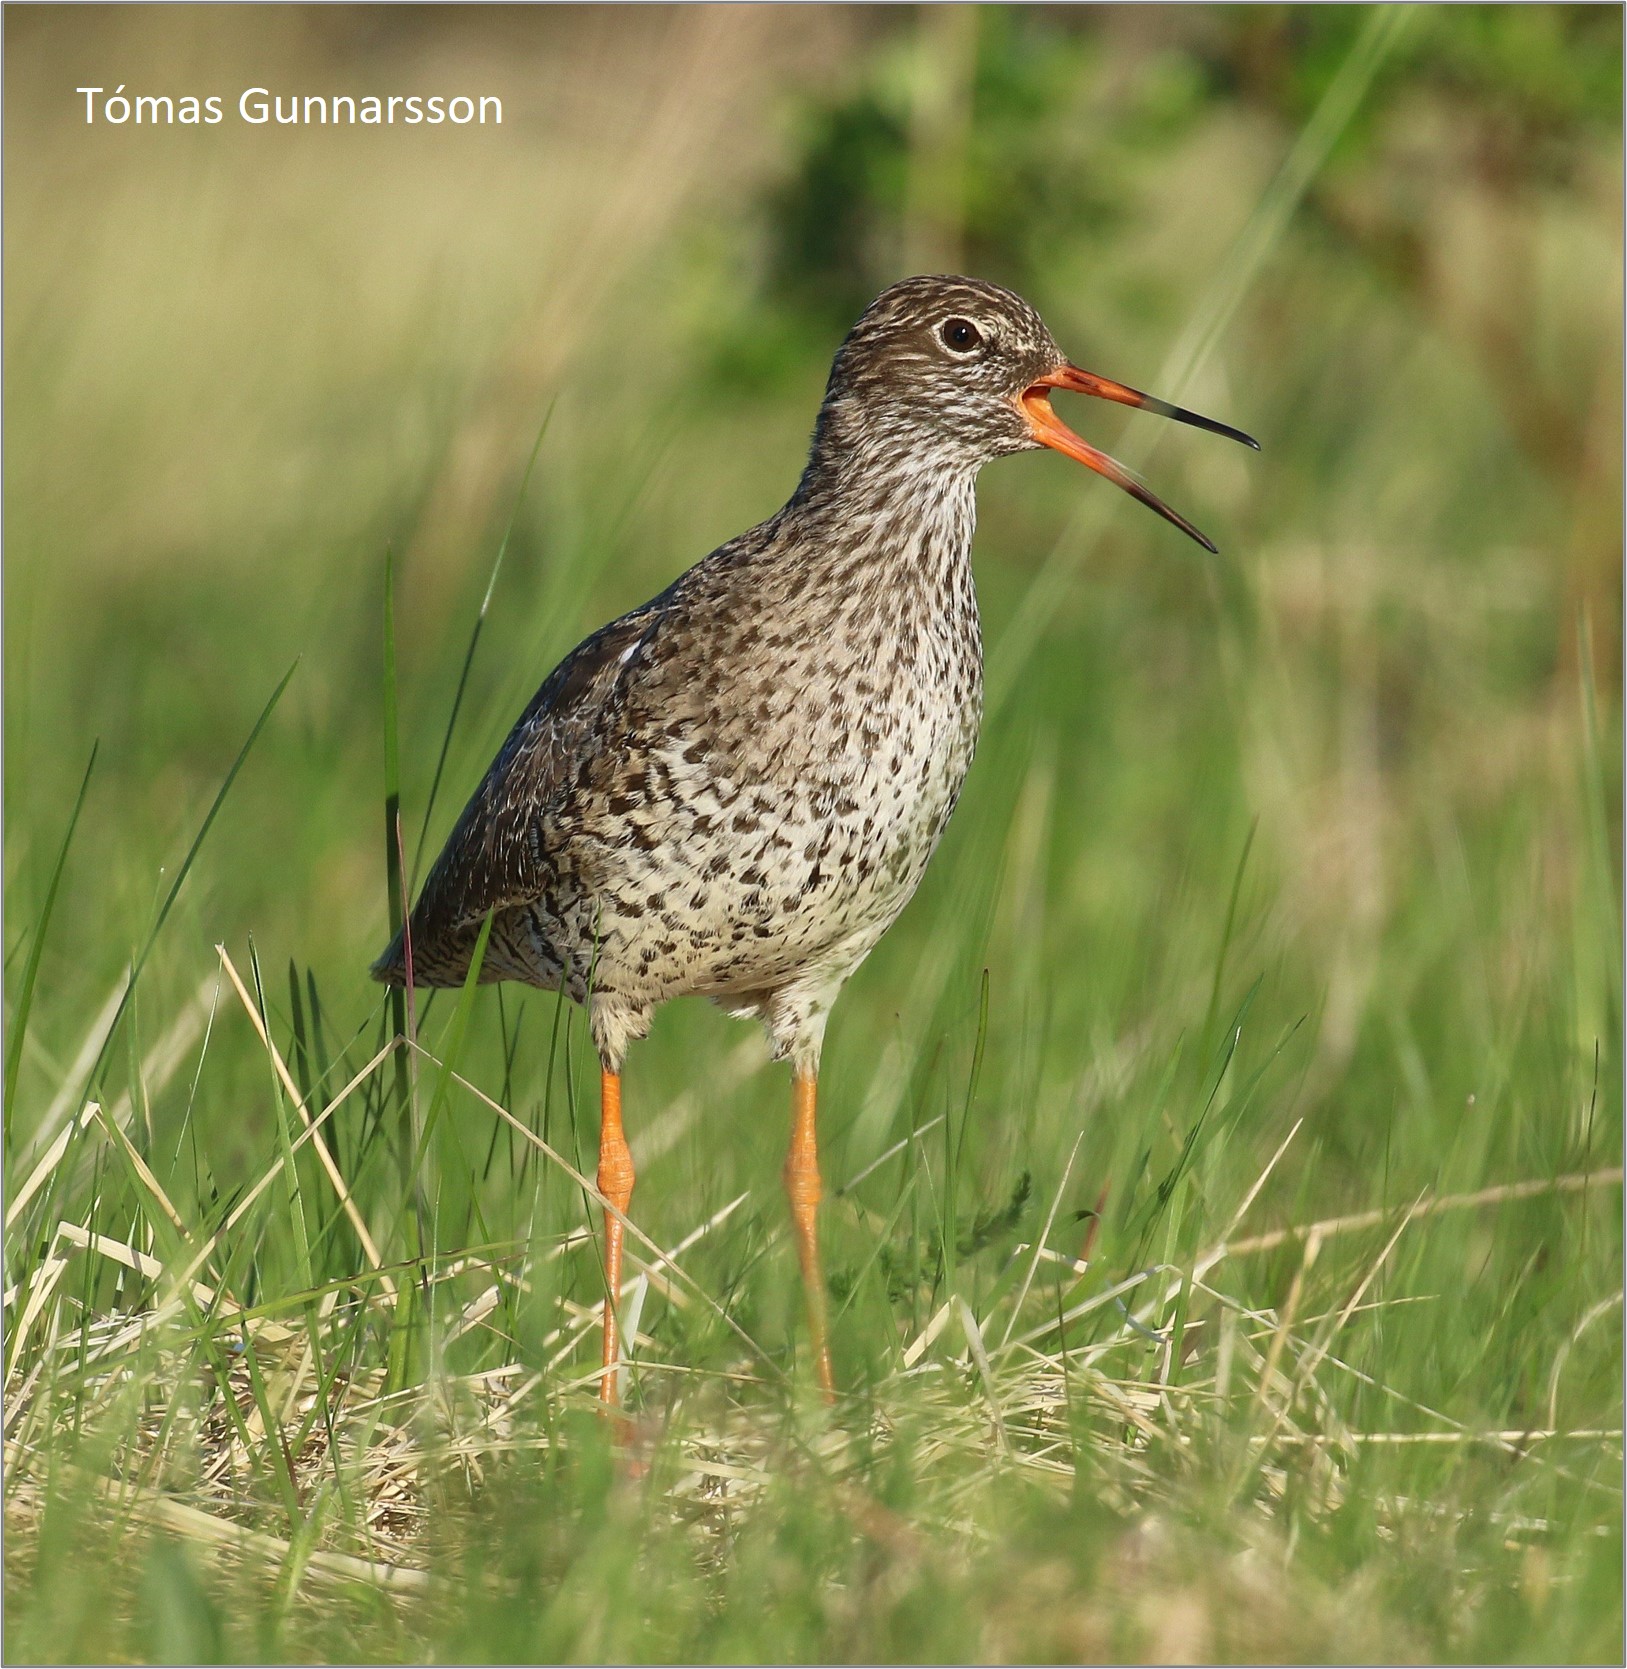
  • Although Redshank did not show a linear relationship with distance from plantation edges, densities were lowest close to the plantation edge.
  • There were more Redwings close to woodland edges but Meadow Pipit showed no change in density with distance from plantations.

Golden Plover, Whimbrel and Snipe were found in lower densities close to the tallest plantations (over 10 m), when compared to younger plantations (tree height 2m to 5m), suggesting that the impact of forests gets more pronounced as the trees grow. Plantation density and diameter had no additional effect on the species that were in lower densities closer to the plantations, implying that the mere presence of plantations induces the observed changes in abundance. See the paper for more details.

The bigger picture

Aldís Pálsdóttir and Harry Ewing walked every step of every transect and made detailed counts of what they saw – data that are invaluable when considering local impacts of plantations – but the paper becomes even more interesting when the authors look at the bigger picture. When plantations are distributed across these open landscapes, in different configurations, what will be the accumulated effects on the numbers of breeding waders? They estimate likely changes in abundance resulting from planting 1000 ha of plantation in different planting scenarios, ranging from a single block to lots of small patches.

  • Planting 50 smaller patches of 20 ha, instead of 1000 ha of forest in one large patch, is estimated to double the resulting decline in abundance (because there is more forest edge and hence a bigger effect on more open habitat)
  • This effect increases even further as the patches become smaller; in their models, planting 1000 blocks each of 1 ha would have nine times the impact of planting one forest of 1000 ha.
  • Proximity of woodland seems to be the driver of local distributions of breeding waders so the authors suggest that the amount of edge (relative to area) should be minimised, to reduce the impact of a plantation – which means making forests as near circular as possible.

It is clear that fewer larger forestry plots are likely to be less bad than lots of small, local plantations, in terms of the effects on wader populations. The figure below illustrates how much more land is affected when one woodland is replaced by four with the same total area. The grey area (equivalent to a 200 metre annulus) accounts for 88 hectares in the one-patch illustration and 113 hectares for four patches.

An urgent need for action (and inaction!)

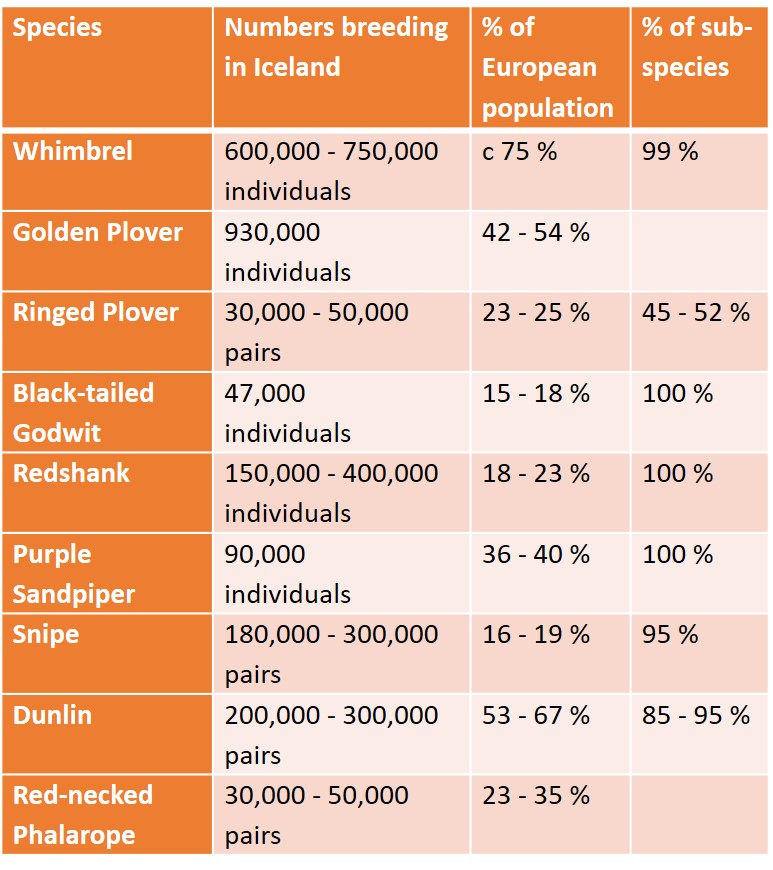
Iceland holds large proportions of the global nesting populations of Golden Plover (52%), Whimbrel (40%), Redshank (19%), Dunlin (16%) and Black-tailed godwit (10%) (see Gunnarsson et al 2006) and is home to half or more of Europe’s Dunlin, Golden Plover and Whimbrel. Data in the table alongside have been extracted from Annex 4 of the report, which was discussed at the 12th Standing Committee of AEWA (Agreement on the Conservation of African-Eurasian Migratory Waterbirds) in Jan/Feb 2017.

Aldís measured the areas of 76 plantations in her study, using aerial photographs. The total area of woodland was about 2,800 ha and the total amount of semi-natural habitat in the surrounding 200 m was about 3,600 ha. Using the reduced densities that she found on the transects and the direct losses for the plantations themselves, she estimates potential losses of about 3000 breeding waders, just around these 76 forest plots. Extrapolating this figure to the whole of the Southern Lowlands of Iceland, the total losses resulting from all current plantations are likely to already be in the tens of thousands. Worryingly, the densities measured on the transects in this paper (even 700 m from forest edge) were well below those measured (slightly differently) in previous studies of completely open habitat, suggesting that losses may already be significantly higher than estimated in the paper.

A scary statistic in the paper is that “6.3% of the Icelandic lowlands is currently less than 200 m from forest plantations”. Given the incentives to plant lots more trees, this is particularly worrying for species such as Black-tailed Godwits, the vast majority of which breed in these lowland areas (between sea level and 300 metres).

Non-native trees are spreading beyond the boundary of a planned forest

It has been suggested that breeding waders might move elsewhere when impacted by forestry but migratory wader species are typically highly faithful to breeding sites. If birds are not going to move to accommodate trees, then perhaps plantations should be located where bird numbers are naturally low, such as in sparsely or non-vegetated areas, at higher altitudes and on slopes? Planning decisions could usefully be informed by surveys of breeding birds, to identify high-density areas that should be avoided.

The severe impact that planting forests in open landscapes can have on populations of ground-nesting birds emphasises the need for strategic planning of tree-planting schemes. Given Iceland’s statutory commitments to species protection, as a signatory to AEWA and the Bern Convention on the Conservation of European Wildlife and Natural Habitats, and the huge contribution of Iceland to global migratory bird flyways, these are challenges that must be addressed quickly, before we see population-level impacts throughout the European and West African Flyway.

To learn more

The take-home message from this work is clear. Local planning decisions and the ways in which forestry grants are allocated are producing a patchy distribution of plantations across the lowlands of Iceland, and this is bad news for breeding waders.

The paper at the heart of this blog is:

Subarctic afforestation: effects of forest plantations on ground-nesting birds in lowland Iceland. Aldís E. Pálsdóttir ,Jennifer A. Gill, José A. Alves, Snæbjörn Pálsson, Verónica Méndez, Harry Ewing & Tómas G. Gunnarsson. Journal of Applied Ecology.

Other WaderTales blogs that may be of interest:

Forest edges

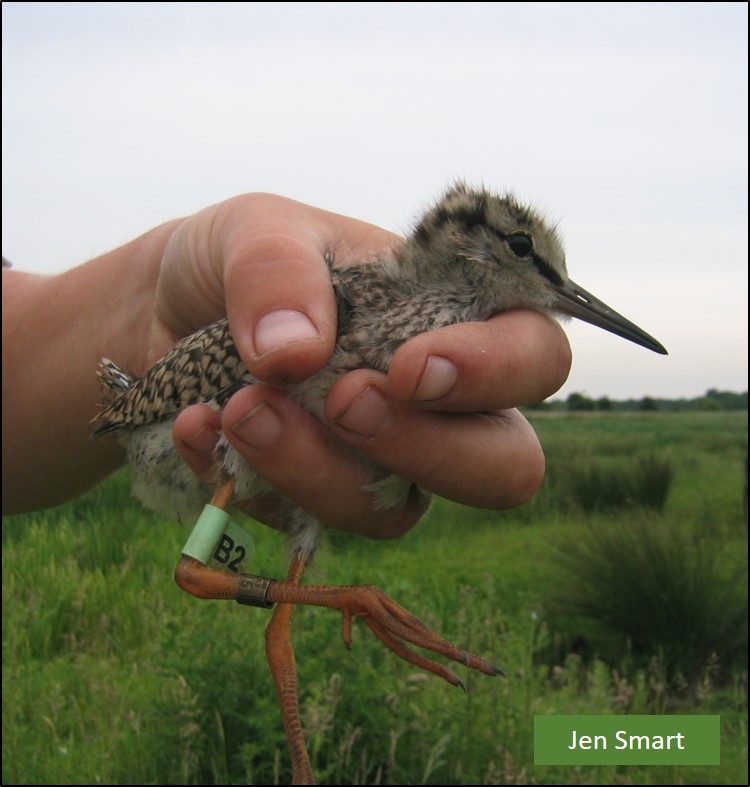
Work by Aldís Pálsdóttir (pictured right)

Changing agricultural systems in Iceland (work by Lilja Jóhannesdóttir)


WaderTales blogs are written by Graham Appleton (@GrahamFAppleton) to celebrate waders and wader research. Many of the articles are based on published papers, with the aim of making shorebird science available to a broader audience.

Power-lines and breeding waders

Around the globe, people are consuming more energy, much of which is delivered to cities, towns, individual homes and businesses via over-head electricity cables. In a paper in Ibis, Aldís E Pálsdóttir and colleagues investigate the effects of power-lines on Iceland’s breeding waders. This is the first of several papers from Aldis’ PhD thesis, in which she seeks to understand how forestry and the sprawl of new infrastructures (roads, cottages and power-lines) are changing bird distributions within what were previously open landscapes.

Breeding waders in Iceland

Iceland is a hot-spot for breeding waders, holding half or more of Europe’s Dunlin, Golden Plover and Whimbrel, in a country that is a bit smaller then England. In a 2017 report prepared by AEWA (Agreement on the Conservation of African-Eurasian Migratory Waterbirds), in response to concerns about the effects of afforestation on Iceland’s waterbirds, we learn that:

“Iceland is second only to Russia in its importance as a breeding ground for migratory waterbirds in the AEWA region. It supports the most important breeding populations in Europe for six species of waders and is the second most important country for three.”

Data in the table alongside have been extracted from Annex 4 of the report, which was discussed at the 12th Standing Committee of AEWA in Jan/Feb 2017.

Power lines

For waders nesting in Iceland, power-lines are a new addition to a once-open landscape. Pylons provide potential nesting opportunities for Ravens and perches for Gyrfalcons, while the wires between them are a collision risk. Under power-lines, carcases of swans, geese and waders may attract scavenging Arctic Foxes and Ravens, thereby increasing the activities of nest predators. Perhaps these actual and perceived threats affect densities of breeding waders in the vicinity? Or might birds react to something less obvious, such as the emission of UV light or electromagnetic radiation?

In Iceland, the vast majority of electricity is produced from hydropower or geothermal sources, often long distances from the areas in which the power is used. A new move to develop the wind energy sector has the potential to further add to the number of power lines and introduce them in more areas of the country. Much of the increase in electricity production over the last fifty years has been used to fuel industries such as aluminium smelting and there is the potential to further expand generation capacity, perhaps exporting some electricity to other countries.

Much of Iceland’s electricity is used to power aluminium smelters (here, in Hvalfjörður)

Counting the birds

Aldís counting waders on a transect

Aldís conducted the fieldwork for this study between the 6th May and the 20th June 2019, counting birds along 85 transects of between 300 m and 500 m, running perpendicular to power lines. The full methods are described in the paper but it is interesting to see that they included a check to see whether there were different results if walking towards or away from the power lines. Each transect was divided into intervals of 50 m length, each corresponding to 1 hectare of surveyed land. For each power line, Aldís recorded the number of cables, pylon characteristics, and the height and voltage of the line.

Results

In total, 1067 birds of 21 different species were recorded on the 85 transect surveys. Over 90% of sightings were of eight species considered in the subsequent analysis: Dunlin, Black-tailed Godwit, Golden Plover, Meadow Pipit, Redshank, Redwing, Snipe and Whimbrel. Having analysed the data, Aldís and her colleagues concluded that:

  • For all eight species combined, the areas closest to the power lines (0-50 m) supported densities of approximately 112 birds/km2 (±13 SE) which increased by approximately 58% to 177 birds/km2 (±24 SE), in the sector that was between 450-500 m away from the power-lines. On average, there was a 4% increase in abundance between adjacent 50 metre bands.
  • At the species level, Redshank (figure below) and Whimbrel density increased significantly with distance from power lines (18% and 9% per 50 m, respectively) but no other significant effects were detected for other species individually.
  • There were no detectable difference between types of power-lines or relating to the voltages of the electricity they carried.

Implications of the research

In the paper’s discussion there are questions as to why densities of Redshank and Whimbrel (right), in particular, are lower near power-lines. The two species behave differently while nesting, with Redshanks being nest-hiders and Whimbrel nesting in the open, but previous research has shown that their nest predation rates are quite similar (see Where to nest?).

The reason why significant reductions in density close to power lines were apparent for Whimbrels and Redshanks (but not for other species) is not clear but the authors suggest that sample sizes may have been too low for there to have been measurable effects for species such as Dunlin and Golden Plover (below).

Power lines could have direct impacts, such as increased collision risk, but this may be difficult to establish directly, as the authors suggest that carcasses are likely to be quickly removed by scavengers.

Ravens may find it easier to find and predate nests if there are pylons or wires on which to perch but it will be hard to discriminate between an actual predation effect, reducing numbers in areas close to power-lines, and the avoidance of risky areas because of a perceived threat of predation. This is discussed in Mastering Lapwing conservation.

Given the depressed density of ground-nesting bird species in the vicinity of overhead power lines, the authors of the paper suggest that burying power lines might be a better option, even though there would be temporary disturbance to the ground during installation.

What are the implications for Iceland’s breeding waders?

It would be interesting to calculate how many Whimbrel and Redshank (left) territories would be lost over the course of a 50 km run of power-lines through open landscapes – and then extrapolate that to 500 km and 5,000 km. As shown in the earlier table, 75% of Europe’s Whimbrel breed in Iceland. How vulnerable are they to power-line infrastructures and what might be the impact on a breeding population of over 300,000 pairs?

This is the first of several papers from Aldis’ thesis, in which she seeks to understand the current rapid changes to Iceland’s lowland landscapes. Links to other blogs and papers will be added as they appear. It should soon be possible to reveal the combined effects of these incursions into open wader habitats, by considering plans that might affect these areas over the next twenty years, working out potential losses and setting these numbers in a flyway context.

This paper is published as:

Effects of overhead power-lines on the density of ground-nesting birds in open sub-arctic habitats. ALDÍS ERNA PÁLSDÓTTIR, JENNIFER A. GILL, SNÆBJÖRN PÁLSSON, JOSÉ A. ALVES, VERÓNICA MÉNDEZ, BÖÐVAR ÞÓRISSON & TÓMAS G. GUNNARSSON. Ibis. https://doi.org/10.1111/ibi.13089

Here’s a link to another blog about Aldís Pálsdóttir’s research: Iceland’s waders need a strategic forestry plan.

A complementary set of papers by Lilja Jóhannesdóttir investigated how changes to Iceland’s farming may also be affecting breeding waders. These are discussed in three WaderTales blogs:


WaderTales blogs are written by Graham Appleton (@GrahamFAppleton) to celebrate waders and wader research. Many of the articles are based on published papers, with the aim of making shorebird science available to a broader audience.

Where to nest?

pic whimbrelThere is nothing more obvious than an Oystercatcher sitting on his or her nest, but a brooding Snipe can be invisible until almost trodden upon. Which strategy works better: nesting in plain view but laying cryptically camouflaged eggs or hiding yourself and your nest in a clump of grass? Which species is most likely to hatch a successful brood of chicks and in what circumstances? In a 2020 paper in IBIS, Becky Laidlaw and colleagues analysed nest site characteristics and nest locations of 469 wader nests in Iceland in order to provide some answers

The perils of ground-nesting

pic hatching whimbrel

Hatching Whimbrel eggs, with the tell-tale shell fragments that signal a nesting attempt has been successful

Almost all waders are ground-nesters, which makes them highly vulnerable to a wide range of nest predators. To reduce the risks of predation, different strategies have evolved. In some species, nests are placed out in the open, and the camouflage is provided only by mottled egg colouration that resembles the background. In other species, nests are secreted in vegetation, meaning eggs and incubating adults are concealed from predators.

In both groups of species, the risk of nests being predated might vary, depending on the surrounding habitat. For open-nesting species, for example, clutches that are laid in large patches of similar habitat may be harder for predators to locate. The same could apply to closed-nest species that hide their nests; Snipe nests may be tricky to find in extensive areas of long grass but perhaps more at risk if there are only a few suitable clumps of long grass that predators need to check out.

pic hidden Redshank

Iceland: a wader factory

tableAs discussed in previous WaderTales blogs, particularly Do Iceland’s farmers care about wader conservation? Iceland is hugely important as a European ‘wader factory’. As farmland elsewhere has become less suitable for species such as Redshank and Snipe, the global importance of the country has increased (see table alongside for most recent figures from an AEWA report)  With this in mind, it is important to understand the factors that underpin the population dynamics of Iceland’s breeding waders.

Working in South Iceland, Becky Laidlaw and her co-authors tried to find as many nests as possible during the summers of 2015 and 2016. This area is largely a mosaic of open habitats, although there are more patches of forestry than there were twenty years ago. Most of the Southern Lowlands area is farmed, on a gradient between intensive and semi-natural, and this is reflected in the distribution of breeding waders (see Farming for waders in Iceland).

pic rope

Dragging a light rope across the vegetation to flush nesting birds

For this project, nests were located by surveys from vehicles and on foot, through observation of incubating adults, systematic searching, incidental flushing of incubating adults and rope-dragging (dragging a 25 m rope, held between two fieldworkers, lightly across vegetation) to flush incubating adults.

The analysis in the resulting paper in IBIS focuses on 469 nests of three open-nesting species (Oystercatcher, Golden Plover and Whimbrel) and three species that hide their nests in tall vegetation (Redshank, Snipe and Black-tailed Godwit). The team recorded the habitat and vegetation structure around each nest (at the nest, within a 5 m x 5 m square and in a wider 50 m x 50 m square) and worked out which nests hatched successfully and which were predated. The date and time of predation were determined, where possible, with nest-cameras providing extra information for some nests. Cameras captured nest-predation events involving Arctic foxes, Arctic Skuas, Ravens and sheep.

Interestingly, 2015 and 2016 were very different wader breeding seasons. The graphic below shows the mean temperatures for the months from April through to July (encompassing the wader breeding season at this latitude) were much cooler in 2015 than in 2016, representing average monthly difference of between 1.5°C and 2.5°C. At high latitudes these figures translate into very different rates of vegetation growth.

pic pretty graph

First, find your nest

When nests were first located, their positions were marked and referenced using GPS. Eggs were floated in water to provide an estimate of laying date and thereby predict hatching date. As the chick develops within an egg, the density of the egg falls. A newly laid egg will lie on the bottom of the flotation vessel. Over the next few days the ‘blunt end’ rises until the egg is still touching the bottom but vertical. Eggs in the late-development stage float ‘point-end-down’, with the latest eggs floating at an angle to the vertical (method described by Liebezeit et al.).

pic skua-ed goldie eggs

This Golden Plover nest was probably predated by an Arctic Skua

Nests were considered successful if one or more eggs hatched, and predated nests were defined as those that were empty in advance of the predicted hatch date or those without any eggshell fragments in the nest (a sign of successful hatching). To determine the time and date of nest failures, iButton dataloggers were placed in a randomly selected subsample of nests. These loggers recorded a temperature trace every ten minutes. A sharp and permanent decline in nest temperature below incubation temperature indicates nest predation. In both study years, motion-triggered cameras were deployed on a sample of open-nesting species to determine the predator species active on these nests.

When each nest was first located, the percentage of eggs visible from directly above the nest was estimated and the habitat surrounding each nest was assessed in the field at three spatial scales: the nest cup, the 5 m x 5 m and the 50 m x 50 m area surrounding each nest. Details are in the paper.

Which nests survive through to hatching?

Over the breeding seasons of 2015 and 2016, the outcomes of 469 wader nests were assessed. 259 hatched successfully (55%), 192 were predated (41%), 13 were abandoned, 7 were trampled and 2 were mown. A nest-loss rate of 40% is fairly typical for ground-nesting waders, when compared to studies in different countries and habitats.

pic fox attack

Daily nest predation rates did not vary significantly in relation to the habitat heterogeneity or the extent to which the dominant habitat covered the area surrounding the nest, at either 5 m x 5 m or 50 m x 50 m scales. Most clutches were laid in habitats that were the same or similar to the surrounding areas. Where there were differences, the dissimilarity between the habitat at the nest cup and in the surrounding area did not influence daily nest predation rates for open- or closed-nest species. Although nest predation is high, at about 40%, incidence of predation events appears to be unpredictable – or even random.

pic snipe nest

In cold spring conditions, Icelandic Snipe are not able to hide their nests

Daily nest predation rates were significantly higher for closed nests (Redshank, Snipe and Black-tailed Godwit nests) in which a greater percentage of the clutch was visible. This suggests that the onset and rate of vegetation growth could potentially constrain the availability of suitable nesting locations for these species, and hence influence nest success, particularly among early season nests. This has been studied in Icelandic Black-tailed Godwits by José Alves and colleagues and is described in From local warming to range expansion.

For closed-nest species, the visibility of nests was significantly greater during the early part of the 2015 breeding season, when compared to 2016, due to slower grass growth in cooler conditions.  The higher predation rate of more visible nests of closed-nesting species was apparent even though nests were predated up to three weeks after egg visibility was measured. These findings suggest that early nesting attempts by concealed-nest species are unlikely to be successful in years when vegetation growth is delayed or slow. There can be major benefits of hatching early, with recruitment into breeding populations typically being lower for later-hatched chicks, so vegetation growth rates are likely to be really important to species that conceal their nests (Redshank, Snipe & Black-tailed Godwit in this study). However, given the ongoing trend for warmer springs at subarctic latitudes, the conditions in which early nests can only be poorly concealed are likely to be reducing in frequency.

In summary

pic goldie nest in habitat

Golden Plover nest set within a homogeneous habitat matrix

Perhaps surprisingly, nest predation rates were similar for open-nest and concealed-nest species and did not vary with vegetation structure in the surrounding landscape. However, nest-concealing species were about 10% more likely to have nests predated when the nests were poorly concealed, and the frequency of poorly concealed nests was higher at the start of the breeding season in colder conditions.

The paper at the heart of this blog is:

Vegetation structure influences predation rates of early nests in subarctic breeding waders. Rebecca A. Laidlaw, Tómas G. Gunnarsson, Verónica Méndez, Camilo Carneiro, Böðvar Þórisson, Adam Wentworth, Jennifer A. Gill and José A. Alves. IBIS. doi:10.1111/ibi.12827

pic sheep


GFA in Iceland

WaderTales blogs are written by Graham Appleton, to celebrate waders and wader research.  Many of the articles are based on previously published papers, with the aim of making wader science available to a broader audience.

@grahamfappleton


Fennoscandian wader factory


blog tem st

Nesting Temminck’s Stint – the smallest of the 22 wader species for which trends are reported

At the end of the summer, vast numbers of waders leave Norway, Sweden and Finland, heading southwest, south and south-east for the winter. In a 2019 paper by Lindström et al, we learn what is happening to these populations of Fennoscandian breeding species, as diverse as Temminck’s Stint and Curlew. The news for the period 2006 through to 2018 is basically pretty good – most populations have been stable and there are even some that have increased – but there are worrying signs for Broad-billed Sandpiper, Red-necked Phalarope and Whimbrel.

Breeding waders of Fennoscandia

blog mapAs a volunteer taking part in the Breeding Bird Survey (BTO/JNCC/RSPB) in the UK, I feel that I do my bit to monitor what is happening to local bird population – providing counts that build into national trends. The work involved in delivering indices for breeding waders across the area of Fennoscandia shown in the map is in a different league. Here, counters visit habitats as diverse as forests, wetlands, mires and tundra, within the boreal and arctic areas of Norway, Sweden and Finland. Some survey sites are so remote that access requires the use of helicopters.

Fennoscandia provides important breeding areas for a large set of wader species, and models suggest that these habitats may be particularly vulnerable to climate change, especially increasing summer temperatures. The 2006-18 analysis in Wader Study, the journal of the International Wader Study Group, presents population trends for 22 wader species. The trends are based on 1,505 unique routes (6–8 km long), distributed over an area that’s about four times that of the United Kingdom. 

blog surveyor

The surveys took place across the whole of Norway and Finland, and in the northern two thirds of Sweden, between 58°N and 71°N, which largely coincides with the boreal, montane and arctic regions of Fennoscandia. The systematic distribution of these routes ensures that the main habitats in these countries are sampled in proportion to the area they cover. The paper describes the methodologies used in the three countries and the way that data were combined, especially factors used to translate sightings of individuals into ‘pair-equivalents’.

Overview of results

blog mountainLooking at the results from across Norway, Sweden & Finland:

  • In terms of pure numbers, Golden Plover was the most commonly encountered wader species, followed by Wood Sandpiper, Snipe, Greenshank and Green Sandpiper.
  • The five most widespread species, seen on the highest number of routes, were Snipe, Green Sandpiper, Greenshank, Wood Sandpiper and Common Sandpiper.
  • Wader species richness and the total number of wader pairs were both higher with increasing latitude; the median number of wader pairs per 10 km increased from just below 3 at latitudes 58–60°N, to just above 26 at latitudes 69–71°N.
  • Using a multi-species indicator, the research team found no general change in wader numbers over the period 2006-18.
  • The trends were significantly negative for three species: Red-necked Phalarope (-7.9% per year), Broad-billed Sandpiper (-5.4% per year) and Whimbrel (-1.3% per year).
  • The trends were significantly positive for three species: Oystercatcher (+4.9% per year), Dunlin (+4.2% per year) and Wood Sandpiper (+0.8% per year).
  • There was no significant trend for another 16 species for which encounters were deemed to be frequent enough for analysis.
  • Population trends of long-distance migrants tended to be more negative than those of medium-distance migrants. This is discussed in detail in the paper.

blog wood sp habitat

Focusing on some key species

The Lindström et al paper is a tremendously rich source of information and references. Here are some species-specific highlights.

Oystercatcher. In the context of a species that is declining across NW Europe, the fact that there is a significant increase in Oystercatchers across Fennoscandia may be surprising. However, the authors note that there was a jump in numbers between 2006 and 2007 with little change since then.

blog l graphLapwing. The trends within the three Fennoscandian countries are very different. In Norway, there has been a dramatic decline (-15.2% per year during 2006–2018) and the Lapwing is now nearly extinct in many areas. The trend in Sweden is also significantly negative (-5.8% per year). In Finland, however, where the species is more widespread and numerous, there has been a strong increase (+5.9% per year) during the same period. See figure alongside.

Golden Plover. No significant change overall. There are some country-specific differences in trends, with a moderate decline in Norway being countered by a moderate increase in Sweden. 

Snipe. The overall trend of this species for each country indicates an initial decline followed by an increase. A similar pattern has been noted in the UK’s Breeding Bird Survey over the same period. 

blog whimbrel

Nesting Whimbrel

Woodcock. The trend for 2006–2018 is basically stable and similar in all three countries.

Curlew. There is no significant trend, overall, but populations in Norway and Sweden have declined at the same time that numbers in Finland have increased.

Whimbrel. Fennoscandian trend indicates a decline of 1.3 % per year. Whimbrel is doing poorly in Norway and Sweden but better in Finland. 

Wood Sandpiper. This widespread species has increased slowly (0.8% per year), a trend that is largely driven by Norwegian and Swedish populations.

blog wood sp

Wood Sandpiper was the second most commonly encountered wader

Redshank. The fact that no change was discernible, suggests that boreal and arctic populations are faring much better than the breeding populations further south in Europe. For example, see Redshank – warden of the marsh.

blog RK

Redshank – more obvious than most breeding waders encountered!

Spotted Redshank. The estimated annual decline for Spotted Redshank is 2.8% per year but the species is too thinly spread for this to provide significant evidence of a decline. This rate is very similar to the recent drop in the Wetland Bird Survey index in the UK. See Fewer Spotted Redshanks.

Broad-billed Sandpiper. This species has the second most negative trend among the 22 species analysed (-5.6% per year). The bulk of information comes from Finland where the trend is even more negative (-7.5% per year). Birds head southeast in the autumn to countries bordering the Indian Ocean – areas for which winter trend data are not available. The species is still considered to be of ‘least concern’ but perhaps this designation may need to be revisited?

Dunlin. Breeding birds in the survey area are largely of the alpina race. The overall trend is significantly positive (+4.1% per year), which is in sharp contrast to the strong declines of the schinzii subspecies that breeds around the Baltic Sea, western Finland and further south and west in Europe.

blog rnpRuff. There were major declines in the period immediately prior to this review (Lindström et al. 2015) but changes reported here are lower (-2.3% per year) and the decline is not statistically significant.

Red-necked Phalarope. The authors write, “This species has the most negative trend of all the 22 species [-7.9% per year], with most data coming from Sweden. We do not know the cause of this decline but, given that this species shares its south-eastern migration route with Broad-billed Sandpiper, whose population exhibits the second largest decline, the relevant problems might largely apply somewhere along the migration routes”.

Link to Britain & Ireland

As shown in Which wader when and why? there are strong migratory connections between Fennoscandia and the British Isles. Some waders, such as Green, Common and Wood Sandpipers, pass through on their way south in the autumn, whilst many more fly here for the winter, to take advantage of the warmer maritime climate.

Three wader species with particularly strong links between Fennoscandia and Britain & Ireland are still shot and eaten in these islands. Each autumn, large numbers of Woodcock, Golden Plover and Snipe cross the North Sea. It is difficult to ascertain figures for the number that are shot but there is agreement that the vast majority are winter visitors, as opposed to native birds. The results presented in the paper suggest that there have been no discernible changes in the Fennoscandian populations of these three game species in the period 2006-18. Two earlier WaderTales blogs focus on Woodcock and Snipe in Britain & Ireland:

blog goldie

There has been no significant change in Golden Plover numbers across Fennoscandia

Two WaderTales blogs about wintering waders in Great Britain and the island of Ireland were published in 2019, based on reviews in British Birds and Irish Birds. These were Do population estimates matter? and Ireland’s wintering waders. The six big losers, in terms of wintering numbers in these islands, were Knot, Oystercatcher, Redshank, Curlew, Grey Plover and Dunlin. Knot arrive from Greenland and Canada, with Grey Plover flying from Russia, but it is interesting to think about this Fennoscandian breeding analysis in the context of winter losses of the other four species.

  • Wintering numbers of Oystercatchers have dropped recently in Britain and in Ireland. The population is made up of migrants from Iceland (more about this here), very large numbers from Norway, birds that stay within the British Isles and smaller numbers from other European and Scandinavian countries. Given there is no discernible decline in Fennoscandia, it seems likely that much of the decline can be attributed to a major fall in Scottish breeding numbers (more about this here).
  • Most Redshank wintering in Britain & Ireland are of local or Icelandic origin. Fennoscandian numbers seem to be stable; if there were any changes, these would probably not be apparent in wintering numbers within the British Isles.
  • The Eurasian Curlew has been classified as ‘near-threatened’ and the species is known to be declining in many areas (see this blog about serious problems in Ireland). Ringing shows a particularly strong link between Finland, where breeding numbers seem to be increasing, and Britain & Ireland. The decline in British and Irish winter numbers is probably being driven by lower breeding numbers within the British Isles and in countries such as Sweden, Norway and Poland.
  • There is a theory that new generations of alpina Dunlin may be more likely to winter within Europe’s mainland estuaries, instead of continuing their westward migration across the North Sea. This might explain the apparent anomaly between the 4.1% per annum rise in Fennoscandian numbers and recent winter declines of 3% in Britain and over 20% in Ireland.

Going forwards

blog helicopter

Some of the survey areas were in particularly remote areas

Many of the study squares that were covered during these surveys are a long way from the main centres of human population in Norway, Sweden and Finland. The governments of the three countries are to be congratulated for supporting this important monitoring, which relied on the commitment of hundreds of volunteers. It is to be hoped that these surveys will continue and that further species-focused work will be able to explain some of the differences across Fennoscandia, particularly between eastern and western areas. The rapid declines in numbers of two species that migrate southeast each autumn (Broad-billed Sandpiper and Red-necked Phalarope) highlights the need for better information about what is happening on the flyway linking Fennoscandia with the Arabian Sea and coastal countries of the Indian Ocean.

Paper

Population trends of waders on their boreal and arctic breeding grounds in northern Europe: Åke Lindström, Martin Green, Magne Husby, John Atle Kålås, Aleksi Lehikoinen & Martin Stjernman. Wader Study 26(3)

Click on the title of paper to access it on the International Wader Study Group website. Paper is only available to members of IWSG. If you have read the whole of this blog you’ll probably want to join!

blog barwit

Nesting Bar-tailed Godwit in smart summer plumage


GFA in Iceland

Graham (@grahamfappleton) has studied waders for over 40 years and is currently involved in wader research in the UK and in Iceland.  He was Director of Communications at The British Trust for Ornithology until 2013 and is now a freelance writer and broadcaster.


Managing water for waders

blog L sittingYour task, should you choose to accept it, is to turn farmland into a haven for breeding waders. The only tools you have at your disposal are tractors and cows and we will give you permission to pump water out of nearby rivers when conditions allow. That’s how it started. These days the diggers look big enough to use on a motorway construction site!

If your aim is to maximise the number of pairs of breeding waders on your lowland wet grassland farm or nature reserve, then one of the key issues is to get the water levels right. The first  part of this blog focuses on providing an appropriate mix of ditches, pools and grazed grassland for species such as Lapwing, Redshank and Snipe and then keeping everything wet enough (but not too wet) during the important chick-rearing season.

The second part of the blog is not just about maximising the number of breeding waders on a nature reserve. It’s also about working with neighbouring farmers, in order to secure fresh water supplies for the future and to reduce the risk of salt-water inundations, associated with sea level rise. In the long-term, stakeholder engagement has proved far more important than habitat management, as you will read below.

Understanding water levels

When developing lowland wet grasslands for waders, an extra five cm of late-winter rain can make a huge difference, especially if you can capture as much as possible of the rain that falls or can draw water from a swollen river. Mark Smart, the former Senior Site Manager for the RSPB’s Berney Marshes and Breydon Water reserve in East Anglia, understands grazing marshes and how to capture and distribute water, in order to provide the muddy edges where wader chicks find insects. An aerial photograph of Berney Marsh shows how Mark has designed a special landscape to capture winter rain – one that is ideal for Lapwings and other waders.

Mark has taken the lessons he has learnt on RSPB nature reserves and shared them widely, a contribution to conservation that earned him one of the 2018 Marsh Awards for Wetland Conservation from the Wildfowl & Wetland Trust.

From wheat and barley to ducks and waders

blog cow eatingThe marshes of the Norfolk Broads have been drying out for 2000 years. By the 1970s, and after over 400 years of farming, the Halvergate Marsh complex was on the point of being fully drained and by 1985 much of the wet grassland in which waders formerly bred had already been lost and turned into arable fields. At this point, the RSPB made its first purchase of land, as they tried to retain at least some of the threatened habitat which is so important to winter wildfowl and summer waders. At the same time, campaigning by local and national conservationists secured legal protection for the unique Broadland scenery and the species that rely upon the habitats it contains, thereby halting the advance of the combine harvesters.

The importance of Halvergate Marshes for wildlife has long been known, and in 1987 it became the site of the UKs first Environmentally Sensitive Area – the prototype for subsequent agri-environment schemes. Lowland wet grasslands are traditionally drained using ‘footdrains’ – narrow, shallow channels that connect low-lying parts of the fields with surrounding ditches, in order to drain them.

blog footdrain

The muddy edges of a footdrain

These same footdrains can be used to hold and manage surface water levels within fields, by blocking the ditch connections with sluices. In the 1990s, Mark pioneered the design and deployment of footdrains on lowland wet grasslands, and the kit needed for their construction. Through his skills, enthusiasm and collaborations with grassland managers throughout lowland England, footdrains and the water that they can contain are now a common sight. Many generations of wader families have enjoyed the invertebrate food that footdrains support.

The breeding season for waders is very short – with the first Lapwing claiming territories in March and most chicks fledged by the end of July. Outside these months, these wet grasslands provide excellent grazing for geese and ducks in the winter and cattle in the summer. The task of nature reserve managers is to work with graziers to try to ensure that cattle deliver appropriate sward heights for winter wildfowl and summer waders.

Not just water

fence 2By creating a hot-spot for nesting birds, within an intensively-farmed landscape, land-managers also produce a food-rich area for predators, attracted in by concentrations of eggs, chicks and sitting adults. Restricting the activities of species such as foxes and crows is an important part of the role of an RSPB warden, carried out through site management and active control measures. By focusing these activities in the winter period, the RSPB’s Halvergate Marshes team are able to stop corvids and foxes from setting up territories within the area that is managed for breeding waders. Electric fencing can help to prevent foxes moving onto the site in spring, while changing the way that core wader areas are managed helps to reduce fox/nest interactions by, for instance:

  • Adding shallow ditches in the right places can break up the site into compartments and reduce the likelihood that nests will be predated.
  • Leaving areas with long grass, that is good for small mammals and the mustelids and foxes that prey upon them, can change the focus of hunting activities.
  • Erecting temporary fencing, during at least the early part of the nesting season, can both provide protection and potentially increase the synchronicity of nesting attempts and hence the ability of birds effectively to mob predators.

blog L chick
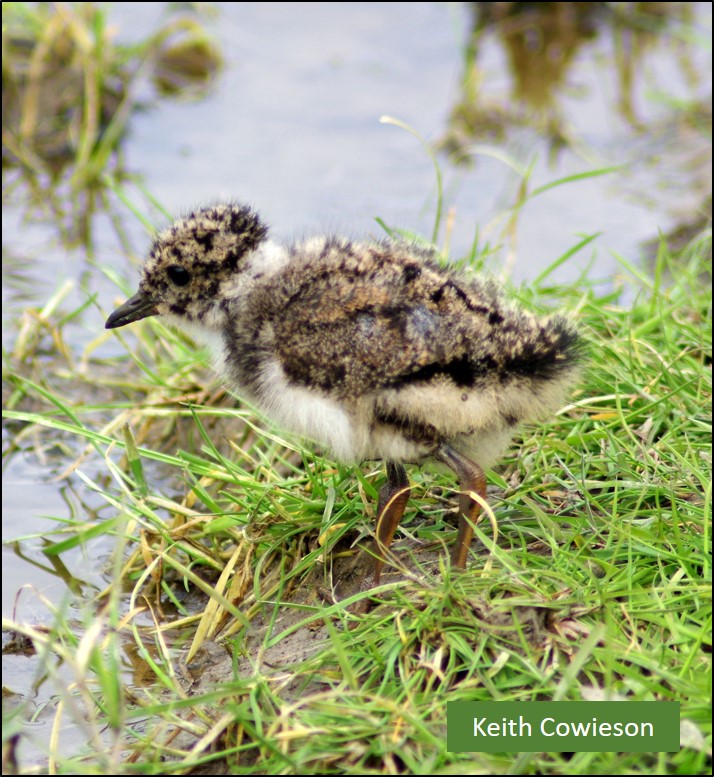
There is more about these measures in these blogs, with links to papers from the RSPB and University of East Anglia team of conservation researchers:

There is annual management of the Berney site too, with foot-drains to be re-cut, spoil to be spread in ways that can provide a mix of water-levels and more muddy edges, and rotovation of some areas to increase the diversity of habitats. These techniques might seem rather different to the ones that are used by farmers but many of the other operations at Berney are the same as would be seen outside nature reserves, with fences to mend, stock to manage and creeping thistle and rush to ‘weed-wipe’.

blog rotovation

Rotovation, carried out in dry conditions, adds heterogeneity and creates bare, muddy areas

Measuring success

The development of Berney Marshes has been hugely successful. Back in 1987, there were only 13 pairs of wader breeding on the site – nine pairs of Redshank and four of Lapwing. The total for 2019 looks like being about 270 pairs – over twenty times as many.

blog RK graph
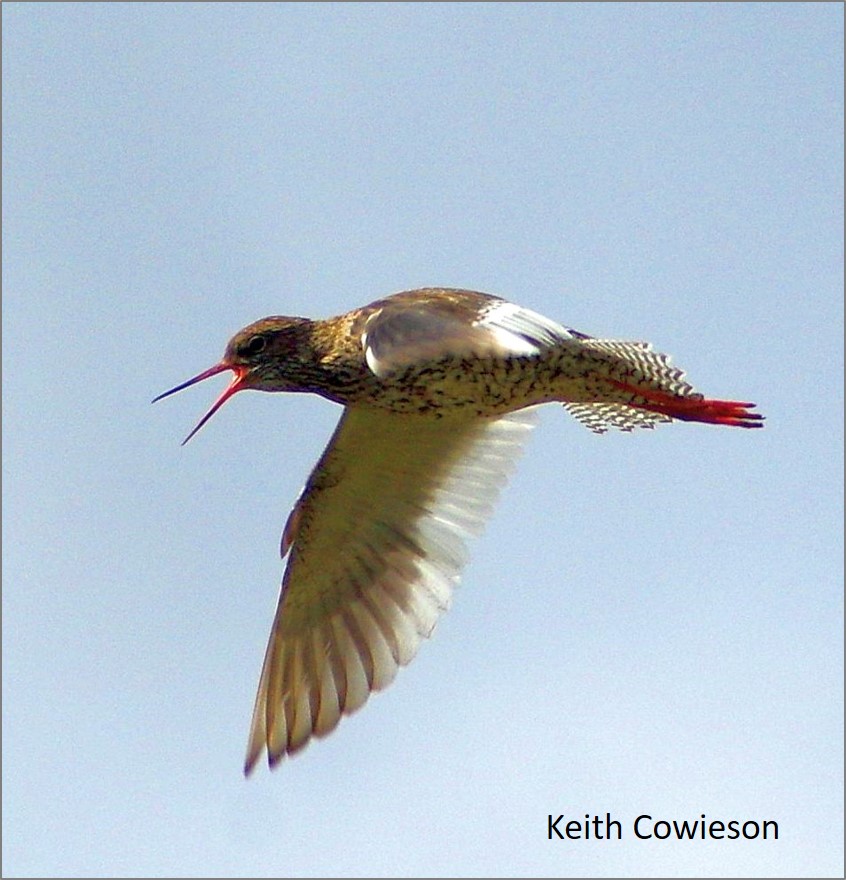
Redshank: The graph alongside illustrates how Redshank numbers have changed across the decades. At the same time as Breeding Bird Survey (BTO, JNCC & RSPB) for England results revealed huge declines, with a loss of nearly half in the period 1995-2017, Redshank pairs on Berney Marshes have been increasing. Even on this site, there is a suggestion that the peak number of pairs may be in the past. Given the pressures on breeding Redshank on saltmarsh habitats (blog: Redshank – the ‘warden of the marshes’), providing breeding habitat in coastal marshes, inside sea-walls, may be particularly important. Hopefully, the latest earthworks (see later) will create more space for Redshank.

Left image below shows Redshank nest in a clump of grass. The right image shows a Lapwing nest in a newly-rotovated patch. 

blog L graphLapwing: Between 1988 and 1998, the number of pairs of Lapwing rose from 14 to 79, reaching a peak of 157 in 2010. Numbers vary, according to spring weather and water levels, with between 83 and 130 pairs in the years 2011 to 2019. The national decline in England was 28% between 1995 and 2017 (Breeding Bird Survey) – not quite as drastic as for Redshank but still worrying. Intensive studies at Berney have shown that productivity is only high enough to boost numbers in some years. The latest project by UEA and RSPB conservation scientists involves trialling temporary electric fences to provide protection for first clutches and broods. Hopefully Berney can become a net exporter of Lapwings in most years.

Oystercatcher: There were no Oystercatchers breeding at Berney back in 1997. The peak number of pairs was 18 in 2009, with an average of ten pairs in subsequent years. Nationally, numbers in England have increased but with major declines in Scotland, which is the species’ heartland within the UK. This is discussed in an earlier WaderTales blog.

Avocet: The RSPB’s logo species has been hugely successful, nationally, with the help of protection and habitat creation. The first pair of Avocets bred at Berney in 1992 and pairs have bred in most years since then, with over thirty pairs in nine years but no pairs in 2013 or 2014. The 2019 count is 35 pairs and there is potential for further growth in numbers across the site, with the creation of more island homes (see below).

blog combine AV

Combined harvesters have been replaced by nesting Avocets

Snipe: Despite all of the excellent habitat creation work, there have never been more than 8 pairs of Snipe recorded on Berney and only between 0 and 3 pairs in each of the last ten years. The underlying soils at Berney are clay-based, which may not suit this species.

Sharing the knowledge

blog RK ringed

Redshank chick: science is an important feature of the work at Berney

Although it’s great that the RSPB has been able to buy and develop land for breeding waders in the Yare Valley, the impact of their work has been far larger, thanks to management agreements with other landowners. Mark Smart and the RSPB have set up Broads Land Management Services, to deliver wet grasslands that attract the top tier of conservation payments for farmers working in the Broads. Much of the recent work has been part of the Water Mills and Marshes Project, funded by HLF and led by the Broads Authority. Using specialist ditch-cutting and spoil-spreading equipment, the team has been able to create wet features within top-quality grazing fields. This is not just a local initiative; the kit and the advice have had impacts on farms and nature reserves across the country.

For his work for wetland conservation, Mark Smart received a Marsh Award for Wetland Conservation from the Wildfowl & Wetland Trust in 2018. “Mark Smart received his award for his 17 years managing RSPB Berney Marshes in the Norfolk Broads. Over this period, he brought together landowners, conservationists, local authorities and scientists to improve the marshes for wildlife. Today more than 300 pairs of wading birds nest there each spring, and more than 100,000 waterbirds return to it each winter.”

blog somerleyton

Illustrations above shows work that has been completed at Somerleyton in Suffolk and a newly-fledged Lapwing.

blog DutchWorking with Jen Smart, who was a Principal Conservation Scientist at the RSPB’s centre for Conservation, Mark has added a Dutch dimension to the RSPB’s advice work by co-authoring Meadowbirds on the horizon of southwest Friesland.  This report has just been published by the International Wader Study Group.

Climate – ‘the new normal’

Fresh water is an increasingly important commodity in East Anglia – for farmers and for nature reserve wardens, looking to maximise agricultural and wader chick production. More extreme weather patterns are already producing periods of drought and intense periods of rain, while a rising sea-level is increasing the salinity of rivers and limiting extraction opportunities. Broadland farmers are looking for a reliable water supply, the Environment Agency is looking for ways to reinforce sea defences and for places to store fresh water, in order to avoid flooding, and the RSPB wants to hold more water in the late winter that can be used to keep areas wet in the early summer. With some lateral thinking, many of the needs of these key stakeholders can be met in partnership projects, as shown below

The Environment Agency’s need for material to raise sea defences provided Mark Smart with an opportunity to provide more pools and scrapes for breeding waders. It was a win-win solution; free habitat creation work for the RSPB and minimal movement of the clay and top-soil that the Environment Agency needed. In the images below, you can see this work in progress and the islands that are now being used by nesting Avocets.

blog defences

The most recent project is an ambitious water storage and flood reduction scheme for the whole of Halvergate Marsh. This will keep salt water out of these important grazing marshes and store fresh water for summer use. The £2 million Halvergate Marshes Water Level Management Improvement Scheme is a joint initiative, funded by DEFRA and delivered by the Water Management Alliance. The project involves a large number of stakeholders, including the Broads Internal Drainage Board, RSPB and neighbouring farming estates.

blog 8 km

The Water Level Management Improvement Scheme is a huge undertaking, with 8 km of new ditches, 240 piped culverts and 12 big sluices, that will create storage for 60,000 cubic metres of fresh water and systems to distribute this water over the course of a dry East Anglian summer. One of the most impressive features of the project, illustrating the imagination of the design team, is the Higher Level Carrier, a ‘flyover’ ditch system that passes over the top of existing wet grazing land to get water to some of the driest part of Halvergate Marshes (left picture below). This high-level water transportation route was constructed using locally-sourced clay, thereby creating shallow pools around which yet more waders are already nesting.

blog overpass

When designing this project, the opportunity was taken to develop opportunities for birdwatchers to see the birds that will be drawn into the wettest areas, by making sure that the ‘best bits’ are close to public access points on the Weavers’ Way, the 61 mile (100 km) long-distance path running from Cromer to Great Yarmouth.

Aspirations

Mark Smart has not finished yet! Plans are afoot to develop the RSPB’s land that is closest to Great Yarmouth, recently purchased using a WREN grant. If agreed, this can provide an alternative, safe high-tide refuge area for tens of thousands of waders and wildfowl that roost on the mud and saltmarsh at the mouth of the Yare. Their current high-tide refuge is threatened by sea-level rise and developments proposed for the outskirts of Great Yarmouth.

blog aspirations

This proposed roosting area will be part of an extension to the Halvergate Marshes Water Level Management Improvement Scheme, which will add another 10,000 cubic metres of water storage. Alongside flood alleviation and fresh-water conservation, this scheme will create fifty hectares of additional shallow wader and waterfowl scrapes adjacent to Breydon Water.

blog Wood sp
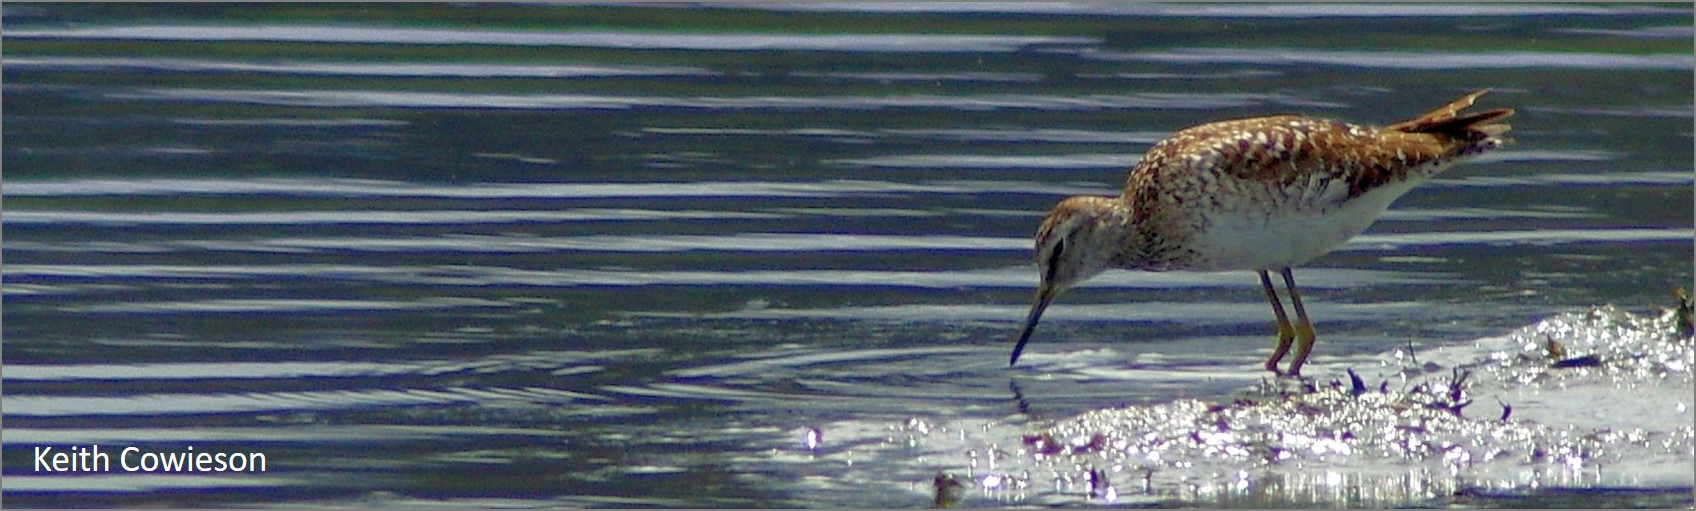
The new scrapes should not only attract wintering and breeding birds but also many passage waders, such as the Wood Sandpiper pictured to the right. The whole scheme has the potential to be another win-win-win-win, for the owners of low-lying properties, for Broadland farmers, for internationally important bird populations and for local and visiting birdwatchers.

Read more

Information about the RSPB’s Berney Marshes & Breydon Water reserve can be found on the RSPB’s website. Click here

There is information about the Water, Mills and Marshes project here.

blog AV


GFA in Iceland

WaderTales blogs are written by Graham Appleton, to celebrate waders and wader research.  Many of the articles are based on previously published papers, with the aim of making wader science available to a broader audience.

@grahamfappleton

Do population estimates matter?

blog top godwitsHow many waders spend the winter in Great Britain? The answer is provided within an article in British Birds entitled Population estimates of wintering waterbirds in Great Britain. It includes all the wader species from Little Stint to Curlew that are covered by the Wetland Bird Survey  This survey is based on monthly counts that take place at about 2000 wetlands and coastal sites. The main aim is to monitor the rise and falls in numbers over time.

Please note that Northern Ireland WeBS figures are included in a separate blog covering the island of Ireland that was published in Irish Birds.

Why do we need to know the total number of birds in Great Britain?

  • If we count the number of Curlew and we have a figure for the European population then we know that Great Britain is responsible for nearly 20% of Europe’s Curlew each winter, thereby strengthening the case for national conservation action;
  • If we have a national figure, then we know that a flock of 2000 Black-tailed Godwit represents (as it turns out) over 5% of the British total, which is a useful criterion when assessing the conservation importance of individual sites;
  • blog GKPopulation totals help to put annual percentage changes into context;
  • And simply because people ask questions such as “how many Greenshank are there in the country during the winter?”

So, here’s the bottom line. In their 2019 review of waterbird numbers in British Birds, a team from BTO, WWT, JNCC & RSPB reveal that an estimated total of 4.9 million waders spend the winter in Great Britain. For several species, GB holds a third or more of the East Atlantic Flyway population!

Making the counts

The population estimates owe a lot to those who undertake monthly Wetland Bird Survey (WeBS) counts on estuaries, lakes and waterways, during the winter months, year in and year out. Counts from the period 2012/13 to 2016/17 are used in the population estimates that form the basis for the 2019 review. WeBS data have many other uses, as you can read here: Wetland Bird Survey: working for waders.

blog CUFor species of wader that also make use of the open coast, the Non-estuarine Waterbirds Survey of 2015/16 (or NEWS III) provided additional data, updating the NEWS II figures from 2006/07.

The vast majority of our wintering Purple Sandpipers are found on open beaches and rocky shores, as well as large numbers of Turnstone, Ringed Plover and Sanderling, together with significant numbers of Oystercatcher, Curlew and Redshank. There’s more about NEWS in this slightly dated blog: NEWS and Oystercatchers for Christmas.

The last assessment of winter wader populations was made by the Avian Population Estimates Panel and published in British Birds in 2013 as Population estimates of birds in Great Britain and the United Kingdom (APEP3). In here, estimates for waders were largely based on WeBS data for the period 2004-09 and NEWS II. The new assessment is presented as Population estimates of wintering waterbirds in Great Britain and also published in British Birds. It uses WeBS information for the period 2012-17 and NEWS III data. Effectively, there is an 8-year or 9-year difference between the two sets of figures.

The biggest losers

blog graphicGreat Britain is extremely important in the context of the East Atlantic Flyway, as is obvious from the fact that the area holds nearly five million waders. The WeBs counts already monitor the ups and downs on an annual basis but this review provides an opportunity to turn the percentages into actual numbers. It is concerning that, over a period representing less than a decade, the average maximum winter count for six of the species that were surveyed dropped by a total of over 150,000. These big losers were Knot, Oystercatcher, Redshank, Curlew, Grey Plover and Dunlin, ordered by number of birds lost, with Knot seeing the biggest absolute decline.

In preparing the new estimates for the British Birds paper, an opportunity was taken to refine the way that populations are calculated, based on Use of environmental stratification to derive non-breeding population estimates of dispersed waterbirds in Great Britain, by Verónica Méndez et al. The new methodology explains some of the differences between percentage changes reported by WeBS and the percentage changes obtained by comparing the latest population estimates to those in APEP3.

blog KN graphic

The Knot estimate dropped from 320,000 to 260,000. This decline is bigger than might be expected from the counts that take place at sites covered by WeBS, being larger than the ten-year decline of 14% reported in the last WeBS report. Knot are mobile species within the North Sea and Atlantic Coast wintering area and it is possible that British losses may be explained, at least to some extent, by redistribution.

blog oyc graph
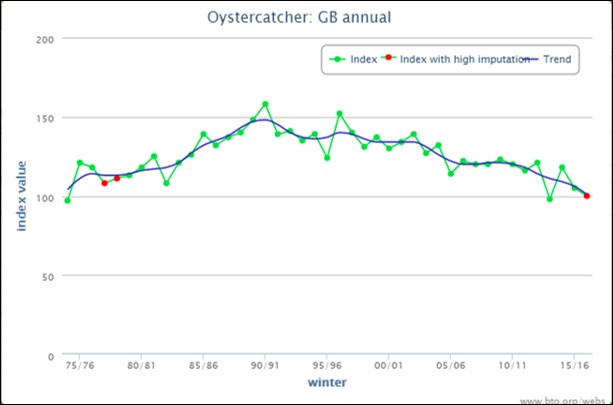
The drop in Oystercatcher numbers from 320,000 to 290,000 appears to be less than 10%, compared to a ten-year decline of 12% on WeBS. Improved analysis of NEWS data helped to add some more birds to the open-coast estimate so the 10% fall may underestimate the seriousness of the Oystercatcher situation. The 25-year Oystercatcher decline on WeBS is 26%, which is not surprising if you look at the changes to breeding numbers in Scotland, where most British birds are to be found. There’s more about this in: From shingle beach to roof-top.

blog RKThe Redshank decline of 26,000 is higher than would be predicted from WeBS figures, suggesting a drop of over 20% since APEP3, rather than ‘just’ 15% for the ten-year WeBS figure. This is a species that also features strongly in the Non-estuarine Waterbird Survey and that might explain the difference. Wintering Redshank are mostly of British and Icelandic origin, with the Breeding Bird Survey (BBS) suggesting a ten-year decline of 24% in our British breeding birds.

The Curlew is now globally recognised as near-threatened. The latest winter estimate is 120,000, down from 140,000 in APEP3. The new total represents between 14% and 19% of the European population, which means that we have a particular responsibility for this much-loved species. Only the Netherlands holds more wintering Curlew than Great Britain. Is the Curlew really nearly-threatened? is one of several blogs about Curlew in the WaderTales catalogue at www.wadertales.wordpress/about .

blog 2 DNIt has been suggested that the long-term declines of Grey Plover and Dunlin  may be associated with short-stopping, with new generations of both species wintering closer to their eastern breeding grounds than used to be the case. WeBS results indicate a 31% drop in Grey Plover and a 42% drop in Dunlin, over the last 25 years. There was a loss of 10,000 for both species between APEP3 and the new review, representing declines of 23% and 3% respectively.

The biggest winners

There are several big winners in the period between APEP3 (2004-09) and the new review (2012-16), although, in some cases, not all is as it seems.

The Avocet has seen further dramatic gains. with the estimated wintering population rising to 8,700. The increase is not quite as big as might have been expected, based on the 43% rise seen in ten years of WeBS counts, but it is still a dramatic continuation of a 40-year trend.

The numbers of Bar-tailed Godwit and Ringed Plover are both substantially higher but at least a proportion of each of these changes is linked to the better coverage and more sophisticated sampling methods that were discussed earlier. Bar-tailed Godwit increases may also reflect redistribution around the North Sea.

blog BW graphOne of the consequences of improved statistical techniques, as used this time around, is the apparent decline in the estimated population of Black-tailed Godwit. The new figure of 39,000 is 4,000 smaller than in APEP3, despite the fact that the WeBS graph clearly shows an increase. Interpolation using WeBs figures suggests that the earlier population estimate should have been 31,000, rather than 43,000.

Sanderling from Greenland spend the non-breeding season as far south as South Africa but  increasing numbers of birds are wintering in Great Britain and Ireland (25% increase in 8 years in GB and 13% in 5 years in Ireland). Interestingly, survival rates of English birds are just as high as those in Namibia. The losers are birds that spend the non-breeding season in equatorial Africa, as you can read here; Travel advice for Sanderling.

There are other winners too, as you can read in the paper. At the start, I posed the question “how many Greenshank are there in the country during the winter?”.  The answer is 810, representing an increase of 200 since APEP3. The vast majority of these wintering Greenshank are birds from the population that breeds in northern Scotland, as you can read in Migration of Scottish Greenshank.

Game species

The estimates for the three wintering waders that are still on the UK quarry list have not changed since APEP3 (published in 2011) as there are no new data available.

Golden Plover: The winter estimate remains as 400,000, as there has been no comprehensive, winter survey since 2006/7. Large numbers of Golden Plover arrive from Scandinavia, Europe and Iceland in the late summer, joining the British birds that choose not to migrate south or west. The GB breeding population is probably less than 50,000 pairs. Most breed in Scotland which has seen a breeding decline of 5% in the period 1995 to 2018 (BBS). Golden Plover is still ‘green listed’.

snipe-headerSnipe (Common): The winter estimate remains as 1,100,000 – a figure that was acknowledged in APEP3 as being less reliable than that of most species. At the same time, the GB breeding population was estimated as 76,000 pairs, indicating at least a 4:1 ratio of foreign to British birds, and that does not take account of the number of British birds that migrate south and west. Snipe are ‘amber listed’ but BBS suggests a recent increase of 26% (1995-2018). There is a WaderTales blog about  Snipe and Jack Snipe.

Woodcock: The winter estimate remains as 1,400,000 – another figure that is not considered to be particularly precise, with much variation between years. The diminishing breeding population is dwarfed by winter numbers, as you can read in this WaderTales blog, with increased attention being given to ways to afford better protection of red-listed, British-breeding birds.

Many of the Golden Plover, Snipe and Woodcock that spend winter in Great Britain are birds that breed in Fennoscandia (Finland, Sweden & Norway). The latest assessment of breeding numbers shows that populations of all three species are stable. See Fennoscandian Wader Factory.

January counts

blog BTThe paper in British Birds also includes a table of January population estimates, to provide data that are comparable to mid-winter counts in other countries. These figures are used in waterbird monitoring for the International Waterbird Census for the African Eurasian Flyway. The main table (and figures mentioned above) are average maximum winter counts (in the period September to March). Black-tailed Godwit is one species that illustrates the difference, with a mean of 30,000 in January and a mean peak count of 39,000. Having moulted in Great Britain, some Black-tailed Godwits move south to France and Portugal in late autumn, returning as early as February. January counts are therefore substantially lower than early-winter and late-winter counts. There is more about the migratory strategy employed by Black-tailed Godwits that winter in southern Europe in Overtaking on Migration.

Looking forward

blog BB coverThe authors have done a tremendous job. They have refined the way that estimates are calculated, they have combined the results from WeBS and NEWS III, and they have delivered population estimates for 25 wader species and many more other species of waterbirds. These population estimates will be used in conservation decision-making until the next set of numbers becomes available. Meanwhile, thousands of birdwatchers will count the birds on their WeBS patches in each winter month, every year. Without them, this paper could not have been written.

Before the next assessment, there will need to be another NEWS survey, to check up on species that use rocky and sandy shore birds, such as Purple Sandpipers, Turnstone and Curlew. Hopefully, there will also be a dedicated survey to assess Lapwing and Golden Plover numbers and perhaps we might find a way to refine the old estimates for Woodcock, Snipe and Jack Snipe.

Paper

Population estimates of wintering waterbirds in Great Britain. Teresa Frost, Graham Austin, Richard Hearn, Stephen McAvoy, Anna Robinson, David Stroud, Ian Woodward and Simon Wotton. Published in British Birds Volume 112. March 2019.

blog flying godwits


GFA in Iceland

WaderTales blogs are written by Graham Appleton, to celebrate waders and wader research.  Many of the articles are based on previously published papers, with the aim of making wader science available to a broader audience.

@grahamfappleton

The waders of Northern Ireland

blog CU postNorthern Ireland is a great place for wintering waders but the same can no longer be said for its breeding species. There are far too few places left in which Curlew bubble and Snipe drum.

Waders provide some of the best birdwatching spectacles in Northern Ireland, as flocks swirl around coastal estuaries, when the tide rises on a winter’s day. Birds fly in from as far away as Canada and Russia but there are particularly strong links to Iceland, about which there will be more later. Every year, winter counts by volunteers, who help with the Wetland Bird Survey, alert us to the ups and down in wintering populations on loughs and estuaries. Unfortunately, we know much less about breeding species such as Lapwing, Redshank, Snipe and Curlew – four species that featured in a Northern Ireland survey in the summer of 2019. Although the annual Breeding Bird Survey monitors birds such as Song Thrush and Willow Warbler, waders are just too thinly spread in Northern Ireland for it to be possible to pick up any year-to-year changes. That’s why they needed a special survey.

blog L flightWe know that there were some great wader hot-spots in the years 1985 to 1987, when a major Northern Ireland survey took place, and that large drops in numbers were reported in 1999 and again in 2013, after other dedicated surveys, but what is happening now? Are there still places where Snipe drum and Curlew bubble? In 2019, the BTO in Northern Ireland asked local and visiting birdwatchers to revisit some of the best places that were identified in previous surveys, to look for breeding waders and to assess the habitats that remain. This work complemented work undertaken by RSPB Northern Ireland during the same period.

Not looking good?

Although it would have been nice to be proved wrong, the expectation was that breeding wader numbers would have declined still further by 2019. This meant, of course, that any remaining sites that still hold species such as Redshank and Lapwing, are going to be even more important than they were thirty years ago. Pessimism is based on trends elsewhere; numbers of breeding waders are falling throughout the UK and increased agricultural intensification within the Republic of Ireland has caused sharp declines in the focal species of the 2019 survey – Lapwing, Redshank, Snipe and Curlew.

The results of the survey are available in a BTO report that can be downloaded HERE. Here are some headlines:

  • Data were received from 75 lowland grassland sites around Northern Ireland, covered by a combination of volunteers, professional surveyors and the RSPB.
  • All of these sites held at least one breeding pair of Lapwing, Curlew, Redshank or Snipe in the late 1980s.
  • 48 of these previously-occupied sites produced zero counts in 2018 and 2019. That’s no Lapwing, no Curlew, no Redshank and no Snipe in 64% of sites.

The following notes give some highlights about Northern Ireland’s waders.

Lapwing

blog Lap map
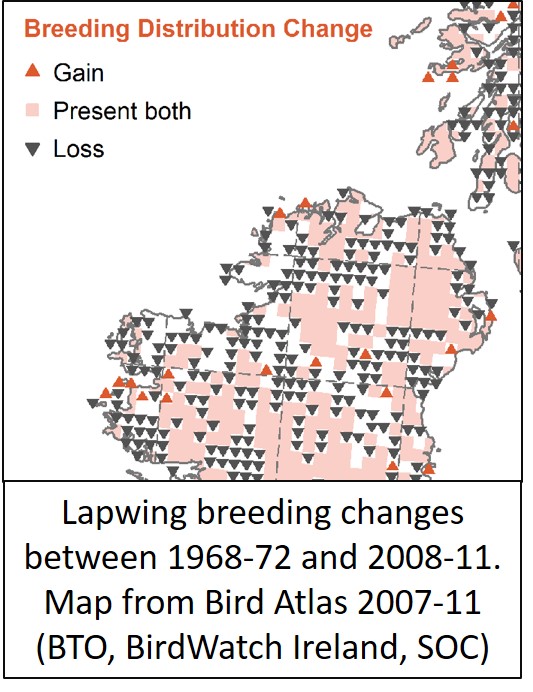
The Lapwing has quietly disappeared from much of Northern Ireland over the last fifty years. The black triangles in the map alongside represent 10-km squares that lost their breeding Lapwings between the two atlases of 1968-72 and 2008-11. Previous Northern Ireland surveys of breeding waders in 1985-87 and 2013 suggest that the number of pairs dropped from an estimated total of 5250 to a total of 860 – that’s a loss of 5 out of 6 pairs.

The latest survey focused on the best sites for breeding waders in Northern Ireland. In these key areas, pairs of Lapwing declined by 70% between 1985–87 and 2018–19.

Redshank

blog RKThere is no recent estimate for the number of breeding Redshank in Northern Ireland. Across the UK, the Breeding Bird Survey suggests that we have lost over 40% of breeding birds since 1995, and the decline was well underway by then. The 2019 survey provided a good opportunity to learn as much as possible about this threatened species. Sadly, across all the key sites surveyed, the number of pairs of Redshank declined by 76% between 1985–87 and 2018–19, .

In the late summer, the tiny Northern Ireland population is joined by Redshank from Iceland and Scotland. There are also a small number of movements linking Northern Ireland with Wales and England; some of these might be of birds from further east in Europe that were ringed in Britain. Strangford Lough peak counts of over 2000 in October illustrate just how much of an influx there is each autumn.

Snipe

blog SN map
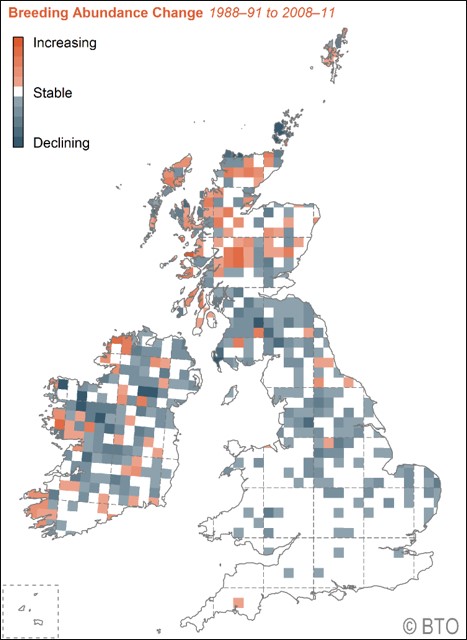
The lowland wader survey in 1985-87 suggested that the Northern Ireland population of Snipe was about 5725 pairs. By the time of the next survey in 1999, that number had dropped to 3993 and then to 1123 in 2013. That’s a drop of 80%. Snipe seem very sensitive to habitat change, especially drainage. The map alongside shows the change in abundance between 1988-91 and 2008-11 across Britain & Ireland. There is an interesting mix of losses (grey) and increases (orange) in Northern Ireland. It would have been great if the 2019 survey has picked up some new Snipe hot-spots. Sadly, in line with other waders, the number of pairs in key sites dropped by 71% between 1985–87 and 2018–19.

blog SN groundThere’s a WaderTales blog about Snipe & Jack SnipeMany of the birds that are seen in Northern Ireland in the winter have flown across the Atlantic to escape the snow and cold of Iceland but there are also birds from Scandinavia and continental Europe

Curlew

The Curlew is in huge trouble across the whole island of Ireland. Surveys of random squares in 1985-87, 1999 and 2013 suggest that the number of breeding pairs in Northern Ireland dropped from 5000 to about 500 over the period. There is talk about potential extinction as a breeding species in Ireland and Wales. This may seem ridiculous when you can see flocks totalling 2000 birds around Lough Foyle, on a winter’s day. However, these are almost exclusively migrants, from Finland, Scandinavia and Scotland. This blog explains why, internationally, Curlew is considered to be near-threatened.

Across all of the key sites surveyed between 1985–87 and 2018–19, pairs of Curlew declined by 80%. There is already concerted action to try to bolster numbers through the Lough Erne Landscape Partnership and it is pleasing to report that Lower Lough Erne region had retained generally higher numbers of breeding waders than elsewhere.

blog CU box

Other Northern Ireland waders

Oystercatcher: Many wintering Oystercatchers leave Northern Ireland in the spring, heading for Iceland, Scotland or perhaps Norway (more in this wader migration blog). By that time, resident adults will already have moved inland or onto beaches to breed and other birds will have returned from southern wintering areas.

blog RPFlocks of young birds are found on estuaries in the summer, as Oystercatchers typically don’t breed until three years old. We know that the number of breeding Oystercatchers in Scotland dropped by 39% between 1994 and 2018 but English numbers rose by 49% (read more here). We don’t know what’s happening in Northern Ireland.

Turnstone: Wintering birds are mostly thought to come from Greenland and Canada but a December capture of a bird from Sweden suggests that there might be a link to the east as well.

Ringed Plover: The most recent UK-wide survey of the species was in 2007, when the Northern Ireland population estimate was 147 pairs, similar to the estimate at the time of the previous survey, in 1987. In the same period, numbers dropped in Scotland (-42%) and England (-29%). Link to summary of paper.

blog GP mapGolden Plover: Ireland is a winter destination of choice for many Golden Plover that breed in Iceland. The recovery of a Belgian-ringed bird in 2006 suggests that some birds may arrive from the east as well. Wintering numbers are half what they were 25 years ago, according to WeBS data for Northern Ireland. A few breeding birds can still be found in the western parts of Northern Ireland but they have been lost from most other areas.

Grey Plover: It’s a long way from Siberia to Northern Ireland, so perhaps it is not surprising that not many Grey Plover make it this far west! A recent colour-ringing programme has been set up in northwest England to see how much movement there is of Grey Plover around the Irish Sea. There’s a recent WaderTales blog about the global migration patterns of Grey Plover.

Knot: The best place to see Knot is in Strangford Lough, where numbers peak at over 4000 in some winters. The only two foreign-ringed birds were shot wearing Icelandic rings in 1957 and 1975 (when shooting them was legal). Northern Ireland’s wintering Knot largely breed in Greenland or Canada and migrate via Iceland. This blog provides the latest information on numbers of waders wintering throughout the island of Ireland. Knot is one of the biggest recent losers.

Sanderling: The Sanderling that are seen around the coast in winter months, in small numbers, will almost certainly breed in Greenland. Numbers are higher in spring, when birds from further south stop off on their way to Iceland and then Greenland. Fascinating new research compares the costs and benefits of travelling different distances in the autumn. Some young birds travel only as far as Northern Ireland, while others migrate to south Africa. Travel advice for Sanderling reveals the best options.

blog DN

Dunlin: Most breeding schinzii Dunlin have been lost from the island of Ireland, with the population now thought to be as low as 50 pairs. Large numbers of birds of the schinzii (green arrows) and smaller numbers of arctica (yellow) race pass through in spring and autumn, on their way to Iceland and Greenland, but the wintering birds are of the alpina race (orange).

blog WK mapWoodcock: The black triangles in the map opposite show the parts of Northern Ireland that have lost breeding Woodcock in the last 50 years. Data are from Bird Atlas 2007-11 (BTO, BirdWatch Ireland & SOC). In late autumn, birds fly in from counties such as Germany, Norway and Russia. See this blog.

Black-tailed Godwit: All is not gloom and doom in the world of waders; there are six times as many Black-tailed Godwits wintering in Northern Ireland as there were 30 years ago. Great views of these Icelandic visitors are provided at the RSPB reserve at Belfast’s Window on Wildlife. This blog explains why numbers have taken off in recent years.

Bar-tailed Godwit: The Bar-tailed Godwit that are seen in Strangford Lough and elsewhere are birds from northern Norway and Russia. There seems to have been little change in numbers, according to Northern Ireland WeBS counters.

blog Whimbrel box

Whimbrel: A few Whimbrel drop in during autumn passage but far more appear in spring. Most Icelandic Whimbrel can fly straight to West Africa in the autumn but 80% stop off on the way north, many in Northern Ireland (see graphic above). You can read more here.

From Avocet to Pectoral Sandpiper

There is a supporting cast of waders that visit Northern Ireland. This blog provides more information on wader migration: Which wader, when and why?

Up-to-date figures

Information about the waders of Northern Ireland is collected annually via the Breeding Bird Survey and the Wetland Bird Survey – new volunteers are always welcome. In the summer of 2019 the special breeding survey, targeted areas shown in this map. Birdwatchers were asked to count Lapwing, Curlew, Redshank and Snipe and to record additional habitat about grazing, rush cover and dampness.

blog mapSites were located in five broad areas :

  • Loughs Neagh and Beg
  • Blackwater Catchment
  • Tyrone Fairy Water Bogs
  • Upper Lough Erne
  • Lower Lough Erne (these sites will be covered by the RSPB)

blog CU banner


GFA in Iceland

Graham (@grahamfappleton) has studied waders for over 40 years and is currently involved in wader research in the UK and in Iceland. He was Director of Communications at The British Trust for Ornithology until 2013 and is now a freelance writer and broadcaster.

Designing wader landscapes

blog whimbrelMuch has been written about the negative impacts of agriculture on breeding birds – but farming can be good for some species. In Iceland, where high-input agriculture is relatively recent, breeding waders are commonly found in nutrient-rich environments that are associated with increased production. How can high breeding densities of waders be maintained, as farming continues to expand and intensification increases?

In her paper in Agriculture, Ecosystems & Environment Lilja Jóhannesdóttir investigates the distribution of breeding waders across landscapes with varying amounts of highly-cultivated fields and semi-natural areas. She discovers that, in some circumstances and at an appropriate level, adding cultivated land within a broader mosaic of habitats may benefit breeding waders. Is this a model system that provides clues as to how to design landscapes that can support sustainable breeding wader populations in other parts of the world?

The waders of Iceland

table

Breeding populations of waders in Iceland (AEWA report)

Iceland is a hot-spot for breeding waders, holding half or more of Europe’s Dunlin, Golden Plover and Whimbrel, in a country that is a bit smaller then England. The paper at the heart of this blog is written by Lilja Jóhannesdóttir, who worked with colleagues from the University of Iceland, the Agricultural University of Iceland, the University of East Anglia (UK) and the University of Aveiro (Portugal). They investigated how different ways of increasing agricultural productivity might impact upon these species, and others such as Black-tailed Godwit, Redshank and Snipe.

Much of Iceland’s upland interior is not suitable as farmland but there is still plenty of room for agricultural expansion. Only 7% of the area between sea level and an elevation of 200 m is currently under cultivation but it is estimated that it would be possible to increase this to 63% – an eight-fold extensification. Icelandic lowlands currently comprise a fine-scale mosaic of open semi-natural habitats and cultivated fields (primarily for silage production to feed animals), making most of the landscape much more heterogeneous than in countries with a longer history of commercial farming.

blog hay and semi-naturalTwo previous WaderTales blogs have already shown that:

Given that farm production is predicted to increase, that farmers like breeding waders and that some intensively-managed fields can be attractive to waders, is it possible to design farmed landscapes that will work for birds and farmers?

Increasing inputs and reducing heterogeneity

blog nice wetlandGlobally, the expansion and intensification of agriculture has altered landscapes and the associated homogenisation has greatly influenced bird abundance and reduced biodiversity. Populations of numerous species, particularly specialist species, have declined, as agriculture has expanded, while generalist species have often thrived in agricultural habitats.

There is no shortage of examples in which highly intensively managed farmland is shown to be bad for breeding waders. In the monoculture hay-meadows of the Netherlands, Black-tailed Godwit productivity is really low, for instance. These fields have been drained, fertilised and re-sown, in order to create easily-managed carpets of single-species grass that can be cut several times a year. There is more about this in this paper by Roos Kentie.

blog hay fieldAlthough there are some areas of Iceland in which farming is quite intensive, there are many others where farmers have a lighter touch. For instance, nutrient-poor dwarf birch marshes may occasionally be grazed by sheep in the summer but these areas have never received applications of artificial fertiliser. At this end of the intensification continuum, increasing agricultural operations may have benefits for breeding waders. When a patch of rough grazing is ploughed and turned into a hay meadow, the addition of fertilisers can potentially increase soil fertility and create an attractive place for waders to feed. A hay meadow within a local area that is dominated by dwarf birch marsh could effectively increase the heterogeneity (& nutrient-richness via spill-over) of the local area, albeit in an artificial way. In the UK, Golden Plovers breeding on moorland are known to travel up to 7 km to feed on fertilised hayfields with high earthworm densities. This paper by James Pearce-Higgins & Derek Yalden in IBIS provides a nice example of how low intensity agriculture can provide resources for waders in the wider landscape.

Researching waders and landscapes

blog dbmLilja’s work in the Southern Lowlands of Iceland focused upon understanding how agriculture influences breeding wader densities and how these relationships might influence future change. At its heart were counts of adult waders encountered along 200 transects (totalling over 100 kilometres) within semi-natural habitats, visited at several stages during the breeding seasons of 2011 and 2012.

As well as counting birds, Lilja categorised habitats within 500, 1000, 1500 and 2500 metres of the transects, which she called buffer area in the paper. Interestingly, and usefully for later analyses, the distribution of different habitat types is pretty uniform across these scales, in this part of Iceland, with little substantial difference according to elevation. In the diagram below, the 200 transects (a) have been split between those below 50 m above sea level (b) and those higher than 50 m (c).

buffers

Landscape-scale effects

To fulfill the various demands of parents and their offspring, waders need diverse resources on or near their territory. An adult can feed a kilometre or more away from its nest, between incubation bouts, and chicks are mobile from an early age. Tagging has shown that young Black-tailed Godwits can move up to 3 km in the first five days of life, just to give one example. In this open landscape, breeding success is likely to be a function of habitat availability at a broad scale. This is explored in a WaderTales blog about nesting Whimbrel.

blog redshankUsing data collected from these 200 lowland transects, Lilja was able to establish relationships between breeding wader densities and the amount of cultivated land and wetland in the surrounding landscape. These two habitat types were considered because future agricultural expansion is likely to take place on drained wetlands that have high conservation value. In her analyses she assessed the extent to which the amount of cultivated land in the surrounding landscape affects wader densities on semi-natural land, and then considered the potential effects of future agricultural expansion on wader populations. There was substantial variation in the density of all of the six most common wader species recorded on the transects, ranging from 0 to 284 birds/km2.

Lilja found that wader densities in semi-natural habitats were consistently greater when the surrounding landscapes had more wetland, at scales ranging from 500 m to 2500 m, indicating the importance of wetland availability in the local neighbourhood. However, the effects of cultivated land in the surrounding landscape varied with fertility and landscape structure, which was largely defined by altitude.

  • In fertile, low-lying coastal areas (from sea-level to 100 m altitude), wader numbers declined with increasing amounts of cultivated land (and the lowest densities occurred in areas dominated by cultivation). This suggests that further conversion of semi-natural habitats into farmland is likely to severely impact waders in low-lying areas.
  • In less fertile habitats at higher altitudes (between 100 m and 200 m), the lowest densities occurred in areas without cultivated land. This suggests that additional resources provided by cultivated land may have a more positive affect in the less-fertile, higher altitude areas.

blog blackwitThe relationships between the areas of wetland and agriculture in the surrounding landscape and the density of waders vary between species, as you can read in some detail in the paper. A few highlights are:

  • With increasing area of cultivated land, densities of Golden Plover, Dunlin and Whimbrel declined significantly at lower altitudes but increased at higher altitudes. These are the three species that would appear to respond most positively to the addition of pockets of cultivated land within a semi-natural matrix of less fertile land, that tends to be found at higher elevations.
  • Higher amounts of wetland were associated with increased densities of Dunlin and Black-tailed Godwit, but lower densities of Redshank. Golden Plover numbers were unaffected by amount of wetland in the surrounding landscape.
  • Whimbrel densities increased with wetland area, at higher altitudes. Wet patches have been shown to be very important to Whimbrel chicks, as you can read in this WaderTales blog about research in Shetland.
  • At lower altitudes, Snipe densities increased with the amount of wetland area in the local vicinity. This relationship was less pronounced at higher altitudes, which tend to be less effectively drained and hence generally wetter.

dunlin graphic

What now?

Changes in Icelandic landscapes are to be expected in the coming years, as most farmers intend to increase their areas of cultivated land. This expansion will inevitably have impacts upon the internationally important breeding wader populations of Iceland but the level of such impact will depend on where the expansion will occur. This paper shows that increases in the area of cultivated land at lower altitudes in Southern Iceland are more likely to result in declines in wader density than in less fertile areas, which are usually found at slightly higher altitudes (still under 200 m above sea level). An important next step will be to identify the landscape structures and scales of management that can continue to support high densities of breeding waders.

blog coastal wetlandGiven the international importance of Iceland as a home for breeding waders it would be nice to think that this paper can be used to develop national land management policies that can prevent the unintended loss of species such as Golden Plover and Snipe, which landowners value and wish to preserve. At the farm and community level, the paper highlights the key importance of maintaining the complex and heterogeneous landscapes of lowland Iceland, retaining as many as possible of the remaining wetland patches and pockets of semi-natural land within even the most intensive of farming areas.

The paper may well be of interest to conservationists who are struggling to reverse wader declines in other parts of the world. In Southern Iceland, where 7% of the land is being farmed relatively intensively within a fine scale mosaic of both wet and dry semi-natural habitats, it is possible to support hundreds of waders per square km across the wider countryside. Can this situation be replicated across large tracts of land in other countries?

Take home message and paper

blog heterogeneousThis paper provides a useful reminder that the links between land use changes and biodiversity implications can be highly context-dependent. Further agricultural conversion of wetlands and rough grazing areas in the fertile low-lying areas of Iceland is likely to be detrimental for breeding waders, but such effects may be less apparent in less fertile, higher altitude areas. Here, the conversion of some land from rough-grazing to hay meadows may provide feeding opportunities off-territory for Dunlin, Golden Plover and Whimbrel. The scale at which the addition of cultivated areas is beneficial to breeding waders has yet to be determined.

This paper is published as:

Interacting effects of agriculture and landscape on breeding wader populations. Lilja Jóhannesdóttir, Jennifer A. Gill, José A. Alves, Sigmundur H. Brink, Ólafur Arnalds, Verónica Méndez and Tómas Grétar Gunnarsson https://doi.org/10.1016/j.agee.2018.11.024

blog end banner


GFA in Iceland

Graham (@grahamfappleton) has studied waders for over 40 years and is currently involved in wader research in the UK and in Iceland.  He was Director of Communications at The British Trust for Ornithology until 2013 and is now a freelance writer and broadcaster.

Scottish Wader Woes

The report on Scotland’s terrestrial bird species, covering the period 1994-2016, did not make easy reading for wader lovers. All but one species was contributing negatively to the upland bird indicator, with declines of over 40% for breeding Lapwing, Curlew, Dotterel, Oystercatcher and Golden Plover. In this short blog, there are links to information that helps to explain what might be going wrong for Scotland’s waders.

The figures from the report have been update in the Breeding Bird Survey for 2018 (published 2019) and these figures are now included below. Golden Plover is no longer part of the ‘over 40%’ club.

The full report is available on the SNH website (https://www.nature.scot/information-library-data-and-research/official-statistics/official-statistics-terrestrial-breeding-birds)

The updated Breeding Bird Survey results are available on the BTO website (https://www.bto.org/our-science/projects/bbs/latest-results)

One species has been increasing – Snipe up 22% *

snipe abundance change* BBS results for Snipe for 1995-2017 revise the change figure to show an increase of 32%.

The one spot of good news is that breeding Snipe numbers in Scotland have risen over the period 1994 to 2016. This is particularly encouraging, given declines in much of the rest of Britain and Ireland, as you can see in the map alongside and read in this WaderTales blog Snipe and Jack Snipe in the UK and Ireland.

In the map, produced for Bird Atlas 2007-11 (BTO, BirdWatch Ireland & SOC), pink colours show abundance increases and grey areas show decreases.

Lapwing declines largest – down 63% *

GHH picture* BBS results for Lapwing for 1995-2017 revise the change figure to show a decrease of 55%.

When a widespread species such as Lapwing is in decline this is bad news. Subtle difference in the way that lowland valleys are farmed may be part of the problem, as illustrated in this WaderTales blog, based on work by Mike Bell, written up with the help of John Calladine, of BTO Scotland: 25 years of wader declines.

Curlew down 62% *

Blog Jill P* BBS results for Curlew for 1995-2017 revise the change figure to show a decrease of 61%.

The Curlew is causing huge concerns in Ireland and Wales, where conservationists are contemplating its disappearance as a breeding species. Scotland holds much larger numbers but a decline of nearly two-thirds suggests that there are major problems here as well.

Two WaderTales blogs tell the Curlew story. Is the Curlew really near-threatened explains why we should be so worried about what is happening and Curlews can’t wait for a treatment plan summarises a BTO-led paper from Sam Franks and colleagues which attempts to explain the patterns we are seeing in the species’ decline.

Dotterel down 60%

IMG_2123

Alistair Baxter

Most of the information about Scotland’s breeding birds comes from annual data collected by volunteers contributing to the Breeding Bird Survey (BBS), organised by the BTO, in partnership with JNCC and RSPB. Dotterel is different; here the counts are dependent on dedicated surveys of Scotland’s high-mountain plateaus. Concern for the species is very much linked to climate change but this blog, based on a paper by the RSPB’s Daniel Hayhow and colleagues, shows that there may well be other reasons for the species decline: UK Dotterel numbers have fallen by 57%. The figure for the decline may be slightly out-of-date but the blog isn’t.

TGG OycOystercatcher down 44% *

* BBS results for Oystercatcher for 1995-2017 revise the change figure to show a decrease of 38%.

In England, the latest BBS report shows an increase of 49% in Oystercatcher numbers but, in Scotland, where there are far more breeding pairs, the species is in decline. Oystercatchers: from shingle beaches to roof-tops looks at the history of the species’ spread from the shoreline, into the hills and onto roofs and considers the role of predation in recent declines.

Golden Plover down 43% *

* BBS results for Golden Plover for 1995-2017 revise the change figure to show a decrease of 10%.

As noted in the press release about the SNH report ‘The golden plover population has declined by 43% since 1994 and stands at its lowest point since the BBS survey began. Declines may be linked to climate change, in part due to impacts on the abundance of craneflies during the breeding season”. There are two interesting papers about this by James Pearce-Higgins and colleagues.

golden ploverPearce-Higgins, J.W., Yalden, D.W. & Whittingham, M.J. 2005. Warmer springs advance the breeding phenology of golden plovers Pluvialis apricaria and their prey (Tipulidae). Oecologia 143: 470–476.

Pearce-Higgins, J.W., Dennis, P., Whittingham, M.J. & Yalden, D.W. 2010 Impacts of climate on prey abundance account for fluctuations in a population of a northern wader at the southern edge of its range. Global Change Biology 16: 12–23.

Common Sandpiper down 39% *

* BBS results for Common Sandpiper for 1995-2017 revise the change figure to show a decrease of 23%.

The Breeding Bird Survey does not properly capture trends for species found mostly along rivers. Data for Common Sandpiper are derived from the BTO Waterways Bird Survey and the Waterways Breeding Bird Survey.

Why no Redshank?

Unfortunately, breeding Redshank are now patchily distributed across Scotland, with too few being picked up by BBS surveyors to make a contribution to Scottish population indices. Across the UK, the latest published BBS decline is 38%. UK graphs for Oystercatcher, Redshank and Curlew are shown below.

UK BBS


GFA in Iceland

WaderTales blogs are written by Graham Appleton, to celebrate waders and wader research.  Many of the articles are based on previously published papers, with the aim of making wader science available to a broader audience.

@grahamfappleton


Farming for waders in Iceland

Across the world, agriculture is one of the primary threats to biodiversity, as we tear up natural environments to create more space to feed an ever-growing and increasingly meat-hungry human population. Agricultural land can, however, also provide key resources for many species whose behaviours align with the rhythms of the farming year.

blog cows

In Iceland, farming areas support large and important populations of several wader species, including 75% of Europe’s Whimbrel and over half of Europe’s Dunlin. As the country welcomes more tourists and expands the range of crops grown for food and fuel, what might be the implications for iconic species such as Whimbrel, Dunlin and Black-tailed Godwit?

This paper by Lilja Jóhannesdóttir, of the University of Iceland, and colleagues there and at the universities of Aveiro (Portugal) and East Anglia (UK), investigates the use of farmland by waders living in a semi-natural landscape.

Paper details: Use of agricultural land by breeding waders in low intensity farming landscapes Lilja Jóhannesdóttir, José A. Alves, Jennifer A. Gill, & Tómas Grétar Gunnarsson Animal Conservation. doi:10.1111/acv.12390

A dynamic landscape

blog snipe postIn Iceland, volcanic activity poses serious short-term threats to agriculture, especially in areas close to the mid-Atlantic ridge, which runs through the island from south-west to north-east. Threats from volcanoes include ash-fall, lava, flooding of glacial rivers and earthquakes but, on the plus side, nutritional inputs from volcanoes have beneficial effects on soil fertility in these central areas. Over time, and with the assistance of wind and water, many of these nutrients collect in the lowlands of the country – the areas that now form the main agricultural areas, especially in the warmer south.

The distribution of breeding waders varies across lowland Iceland. A survey carried out between 2001 and 2003 showed that wader densities were greater in areas of the country that had been subject to higher rates of volcanic ash deposition with, for instance, three times as many waders in the south as in the west. See How volcanic eruptions help waders. As was shown in the paper at the heart of that blog, the nutrient signal associated with ash-fall breaks down in farmland. Here, perhaps as a consequence of the application of natural and artificial fertilisers over decades or even centuries, there is no association between ash-fall and wader density. Across the whole country, irrespective of the proximity of volcanoes, nutrient-rich agricultural land attracts waders – but which wader species and across which farmland habitats?

Waders and agriculture

In a previous paper, Lilja Jóhannesdóttir showed that over 90% of Icelandic farmers think it is important or very important to have rich birdlife on their estates, but that farmers also expect to increase the area of farmed land in the coming years. There’s more about this in the WaderTales blog: Do Iceland’s farmers care about wader conservation? It is important to understand the ways that waders currently use farmland, in the hope that nesting waders can continue to be accommodated within the future farming landscape of Iceland.

blog oyc bare

Perhaps Oystercatchers think that the fields have been ploughed especially for them?

Agriculture in Iceland is still relatively low in intensity and extent, and internationally important populations of several breeding bird species are abundant in farmed regions. Only about 2% of land is cultivated (about 7% of lowland areas), of which about 85% is hayfields (grass fields managed to produce crops of grass for storage as winter feed) and 15% consists of arable fields (mostly barley). This is similar to areas such as Norway, northern Canada and northern and western areas of the British Isles but contrasts sharply with the US and many countries in the EU which, on average, have 20% or more of their land under cultivation.

In these high-latitude landscapes, agricultural land can potentially provide resources that help to support wader species. To address these issues, Lilja conducted surveys of bird abundance on 64 farms in northern, western and southern areas of Iceland that vary in underlying soil productivity, and quantified:

  • Levels of breeding bird use of farmed land managed at three differing intensities, ranging from cultivated fields to semi-natural land
  • Changes in patterns of bird use of farmed land throughout the breeding season.

Farm survey

In Iceland, there are still large patches of natural or semi-natural habitats; they surround the hay-fields and arable fields that are at the heart of many farms. This arrangement creates gradients of agricultural intensity from the farm into the surrounding natural land, tapering from intensive management to moderate and light management.

BLOG gradient

The three intensity levels within Icelandic farmland can be roughly described as follows:

  • Intensive: Hayfields (85%) and arable fields (15%) fields. Most hayfields are mown twice per year and ploughed and reseeded every few years.
  • Moderate: Old hayfields that are rarely or never mown but are used for grazing, or fertilized grasslands used for livestock grazing.
  • Light: Semi-natural or natural areas under low intensity grazing, usually by sheep or horses, or with no agricultural influence, ranging from sparsely vegetated habitats to habitats with abundant vegetation (where grasses and bushes dominate the vegetation) and with a broad wetness gradient.

Fields corresponding to these three categories were surveyed on the 64 farms, firstly during the egg-laying and incubation period and then later, to coincided with chick rearing.

blog 3 habitats

Gradient of management from intensive (left) to wet semi-natural (right)

Where were the waders?

blog RK on postLarge numbers of waders were encountered in all transects in all parts of Iceland, with Black-tailed Godwit and Redshank contributing most records. There were also important numbers of Oystercatcher, Golden Plover, Dunlin, Snipe and Whimbrel. Overall, wader densities on farms did not vary significantly between regions or between early and late visits but there were some subtle differences:

  • Wader density varied significantly along the management gradient, with lower densities tending to occur in more intensively managed areas, particularly in the early (nest-laying and incubation) season.
  • Intensively managed fields in the west (where underlying soil productivity is lower) had higher densities of waders than in the north and south of the country.
  • There were seasonal declines in wader density on all three management types in the south, but seasonal increases on intensive and moderate management in the west and in fields under moderate management in the north.
  • There were some differences between species in these patterns (more details in paper).

blog redshank westOne of the interesting differences in the west was the redistribution of Redshank as the season progressed. There were three times as many pairs of Redshank in cultivated land during the chick-rearing period than during incubation, suggesting that adults may be moving broods into cultivated land. Resources for chicks may well be relatively more abundant or accessible in these areas, given the relatively low levels of nutrients in areas that are a long way from the active volcano belt. There’s also a suggestion that drainage ditches around cultivated fields in the west may provide important resources for Snipe.

What about the future?

blog distributions

Wader densities during the early (red) and later (blue) part of the breeding season (Modified from the paper in Journal of Animal Conservation)

Although the density of birds in Iceland’s agricultural landscapes tends to be higher in lightly managed than intensively managed agricultural land, densities in the areas under the most intense agricultural management are still high, suggesting that agricultural habitats provide important resources within these landscapes (see figure alongside). These density estimates (between 100 and 200 waders/km2) are typically much higher than those recorded in other countries in which these species breed.

Farmers in Iceland expect to expand their cultivated land in the coming years in response to increasing demand for agricultural production (Do Iceland’s farmers care about wader conservation?), and evidence from other countries throughout the world has shown how rapidly biodiversity can be lost in response to agricultural expansion and intensification. Protecting these landscapes from further development is crucial to the species that they support.

The authors suggest ways in which farming practises might change wader distributions in Iceland. Here are a few of the interesting points that they make:

  • When wader-rich semi-natural land is replaced by arable farming and intensively-managed hayfields, this is likely to reduce overall wader densities.
  • Losing wet features, which provide insect food for waders, may well have impacts for chick growth. Here’s a WaderTales blog that discusses the importance of wet features to Lapwings in the UK.
  • In other countries, early grass mowing is a direct threat to nests and chicks. Clutch and brood losses are already being observed in Iceland and, with warmer springs encouraging earlier grass growth, this could become more of a problem.
  • The conversion of less-intensively managed areas into farmland is likely to have most effect on Dunlin, Black-tailed Godwit and Whimbrel, which tend to occur in their highest densities in the least intensively managed lowland areas.

blog walk WhimbrelIt is estimated that between 4 and 5 million waders leave Iceland each autumn, for Europe, Africa and the South Pacific (Red-necked Phalarope). Iceland’s farmland supports many of these birds and this study highlights the need to protect them from the agricultural developments that have led to widespread wader losses throughout most of the world.

You can read the paper here

Use of agricultural land by breeding waders in low-intensity farming landscapes Lilja Jóhannesdóttir, José A. Alves, Jennifer A. Gill, & Tómas Grétar Gunnarsson. Animal Conservation. doi:10.1111/acv.12390

blog oycs & chick


 GFA in Iceland

WaderTales blogs are written by Graham Appleton, to celebrate waders and wader research.  Many of the articles are based on previously published papers, with the aim of making wader science available to a broader audience.

@grahamfappleton