What happens when the mud disappears?

The Yellow Sea provides important ‘service stations’ for shorebirds on the East Asian-Australasian Flyway, especially on their way north to Russian and Alaskan breeding areas. In a thought-provoking paper in Biological Conservation, Xiaodan Wang and colleagues consider how assemblages of waders have changed, as available habitat has been lost on this flyway. Their results suggest that conservation of these migratory shorebirds will depend upon lots of local initiatives.

The Yellow Sea

As discussed in Wader declines in the shrinking Yellow Sea, based on a paper by Colin Studds et al, the number of shorebirds on the East Asian-Australasian Flyway (EAAF) has fallen significantly. The rapid decline has been linked to a sudden drop in the survival rates of adults, especially in Bar-tailed Godwit, Red Knot and Great Knot. For these three species, the proportion of adults dying each year doubled over a period of just three years, with a strong link between species’ dependence upon the Yellow Sea and the rate of decline in numbers. This study and other papers have spawned welcome conservation initiatives and collaborative research programmes in China, South Korea and the Democratic People’s Republic of Korea.

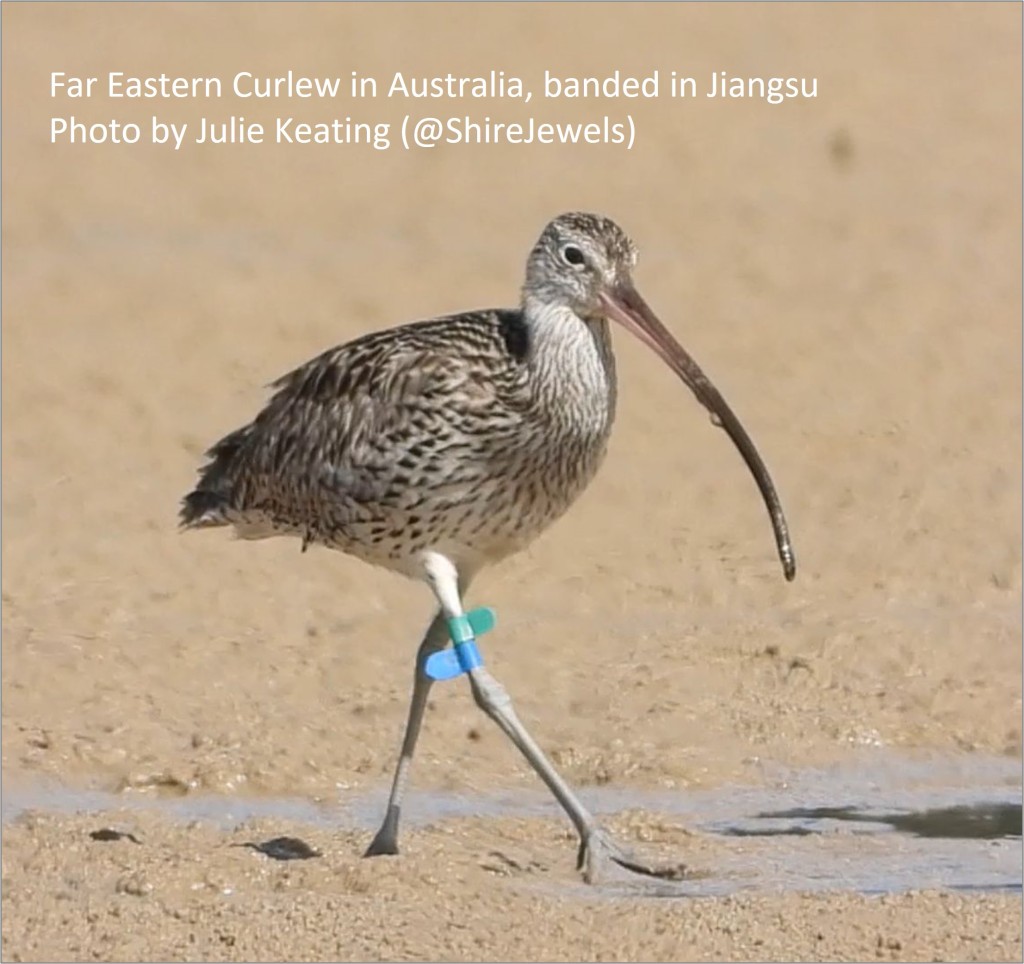
In the most recent appraisal of numbers for EAAF shorebird species that travel as far as Australia, it is estimated that the number of Far Eastern Curlew has dropped to just 35,000 individuals and that there was a 50% drop in numbers for Curlew Sandpiper and Red Knot between assessments in 2008 and 2021. These catastrophic changes show how quickly things can go wrong, especially when adults struggle to get through the annual breed-migrate-moult-fatten-migrate cycle.

In their paper, Xiaodan Wang et al compared the results of shorebird surveys on the Yellow Sea coast of China during northwards migration, between an “early” study period (1996 to 2005) and a “late” study period (2013 to 2014), at 14 stop-over sites. These are sites where large areas of tidal habitat have been destroyed.

What happened?

In their study, the authors investigated three hypotheses:

  • Are trends in population numbers at stopover sites (in China) similar to those detected in nonbreeding sites (e.g. Australia)?
  • Is the diversity within shorebird communities linked to habitat condition?
  • How does a reduction in the area of tidal habitat affect numbers of waders and the composition of shorebird communities?

Counting shorebirds

China’s Yellow Sea region, which extends from the Yalu Estuary (Liaoning Province) in the north, to the Yangtze Estuary (Shanghai) in the south, holds the largest areas of intertidal mudflats in the world. The first comprehensive spring shorebird surveys along this Yellow Sea coast were conducted between 1996 and 2005 (the early period in this study). The Yellow Sea coast was surveyed again in 2013 and 2014 (the late period), by which time large areas of several intertidal flats had been ‘claimed’ and turned into farmland and industrial zones. See paper for methods.

A total of 14 sites were surveyed at similar times, in the early and late periods, enabling comparisons of community richness, the abundance levels of individual species and the density of birds across the available feeding habitat. The key results of the study are:

Counts: The measured decline in bird numbers was on a scale which was less dramatic than those reported from Australia. At the 14 stopover sites, a total of 668,995 individuals of 44 species were recorded in the early period, and a total of 617,146 individuals of 43 species were recorded in the late period. This corresponds to a 7.8% reduction between the early and the late periods.

Species richness: There was much variation between sites, with between 18 and 38 shorebird species recorded, but the numbers of species on each study site were similar between the two periods.

Distributions: Decreased abundance was recorded at ten sites and increased abundance was recorded at four sites. The number of birds on the Liaohe Estuary trebled between the early and late periods, mostly due to the discovery of a flock of 80,000 Great Knot. A recent population assessment of shorebirds of the East Asian-Australasian Flyway suggests that this large flock accounts for 20% of the world’s Great Knot. These passage flocks of Great Knot tend to stay for only a few days, making it hard to reliably pick up any changes between years.

Change across the region: No significant differences were found in species richness or abundance at the same sites, between the periods, but there were significant differences among sites. Ten species were recorded in smaller numbers, with increases for Bar-tailed Godwit (up 16.8%) and Great Knot (57%).

Communities: Bird assemblages at each site were similar in the two study periods, with the commonest species remaining the same. For example, Great Knot and Bar-tailed Godwit are the dominant species in the Yalu Estuary, while Red Knot and Curlew Sandpiper are the dominant species in North Bohai Bay, in both periods.

Loss of habitat: The total tidal flat area decreased by 35.6%, from 4017 km2 in the early period to 2588 km2 in the late period. Habitat loss was detected at all of the 14 sites. More than half of the tidal flat was destroyed at Northern Bohai Bay, Laizhou Bay, Southwest Bohai Bay, and Jinzhou. Relatively small losses (< 10%) occurred at Chongming Dongtan, Yalu Estuary, Jiaozhou Bay, and Liaohe Estuary (see map).

Shorebird densities: Shorebird densities (birds per km2 of mudflat) differed markedly between sites. During the study period, the estimated bird density increased at 7 sites and decreased at 5 sites, with an overall increase in density of over 40% between the early (1996-2005) and late (2013-2014) periods.

Bit of a squeeze?

‘Land claim’ – turning mud flats into farmland and industrial areas – reduced the amount of available feeding habitat in the Yellow Sea study area by 35% between 1996-2005 and 2013-2014. If the same numbers of waders were to be accommodated, then that would imply increases in densities of about 55%. This assumes that feeding conditions remain the same and that spring fattening can happen just as quickly, despite the higher densities. If it’s harder to find food, birds will potentially need to stay longer, to fatten up for the next part of their migration, and that suggests that densities would need to be even higher. The observed change in density of 40% is lower than 55% but this may be consistent with falling populations.

What might be happening?

It is clear that wader numbers in the Yellow Sea have declined, as expected from annual counts in Australia and New Zealand. However, the decline in spring numbers is not as dramatic as might have been predicted. The remaining birds have much less space in which to feed and densities have increased, suggesting that there will be more competition for resources than there was a decade previously. Returning to the three hypotheses put forward by the authors:

Are trends in population numbers at stopover sites (in China) similar to those detected in nonbreeding sites?

Bird surveys covered the same zones and were conducted on similar dates in the early and late periods. Changes in shorebird counts during the study periods did not always exhibit the same population trends as those at nonbreeding sites in Australia and New Zealand.

Is the diversity within shorebird communities linked to habitat condition?

The fact that there are different mixes of waders on different estuaries is probably linked to different food resources. It would be good to know more about the food that is available to species as diverse as small sandpipers and large curlew – especially in the earlier period before so much habitat was lost. Red Knot and Great Knot give hints that waders are found on sites that are appropriate to their needs, with more Great Knot on Yalu Estuary, where the key shellfish they eat (Potamocorbula laevis) are larger, and more Red Knot at Nanpu, where the shellfish are smaller. Given the expected links to available feeding opportunities on individual sites, it is unsurprising that the diversity of shorebird communities has tended to remain the same.

How strong is the link between the change in the area of tidal habitat lost and the changes in the numbers of waders and the composition of shorebird communities?

The research team expected to find changes in shorebird numbers and species composition but the relationships are not as strong as might have been expected, given the areas of mudflat that have been lost.

There is no clear pattern of community change, as just discussed, and this is in line with analyses of more comprehensive annual Wetland Bird Survey data, collected in the United Kingdom. As population levels fell, the changes were spread across all estuaries. Some people may have predicted that distributions would have become more focused on ‘better’ estuaries but this was not the case for wintering waders. Ringing studies suggest that individuals’ site-fidelity is strong, which reduces the potential for distributional change. This study is described in the WaderTales blog, Interpreting changing wader counts, which summarises a paper in Diversity & Distributions, by Méndez et al.

In the Studds paper, there is a clear signal that species that are more dependent on the Yellow Sea exhibited the steepest declines in numbers, so it seems unlikely that there was an excess of available food at the time of the first surveys (1996-2005). If food supplies are limiting, why is the link between habitat lost and numbers not stronger?

The latest estimate of the flyway’s Far Eastern Curlew population is just 35,000

Xiaodan Wang et al discuss why they did not see a clearer relationship between mudflat loss and changes in shorebird numbers. They suggest that population declines may be less severe in some (or even all) of the study sites than might have been expected because these are known hot-spots for waders. Losses may have been more dramatic elsewhere. We know that severe habitat loss can remove most waders from a site, leading to redistribution of affected birds.

It is also possible that individual birds could be staying longer at spring staging sites in the Yellow Sea, due to poorer feeding conditions or changes to the timing of migration. This build-up of birds could mask the scale of the real declines in numbers using Yellow Sea mudflats. In the future, information gleaned from tracking and through resightings of colour-ringed birds should help to monitor stop-over times. Sadly, similar data are not available for the period 1996 to 2005.

Conservation Implications

This paper provides another reminder that structured surveys are immensely valuable. Back in 1996, could anyone have imagined how quickly China’s Yellow Sea mudflats would be turned into farmland and industrial complexes? Extending surveys to more estuaries in the East Asian-Australasian Flyway, using standardized protocols and sharing datasets, will be important, when assessing responses to habitat changes at breeding, stopover, and nonbreeding sites.

Studies at the species level, especially those focused on habitat specialists, have found that some birds cannot successfully relocate to alternate sites if their major staging sites are lost (e.g., Moores et al. 2016). This paper, by Xiaodan Wang et al, concludes that maintaining populations of migratory species along the East Asian-Australasian flyway depends upon the conservation of an extensive network of estuaries within the Yellow Sea.

Paper

The full paper can be accessed here:

Impacts of habitat loss on migratory shorebird populations and communities at stopover sites in the Yellow Sea. Xiaodan Wang, Ying Chen, David S.Melville,  Chi-Yeung Choi, Kun Tan, Jiajia Liu, Jing Li, Shoudong Zhang, Lei Cao & Zhijun Ma. Biological Conservation.


WaderTales blogs are written by Graham Appleton (@GrahamFAppleton) to celebrate waders and wader research. Many of the articles are based on published papers, with the aim of making shorebird science available to a broader audience.

UK waders: “Into the Red”

If you ask British birdwatchers to name the eleven wader species that are causing the most conservation concern in the UK, they would probably not include Dunlin. Curlew may well be top of their lists, even though the most recent population estimate is 58,500 breeding pairs, but would people remember to include Ruff?

This blog is a new incarnation of Nine Red-listed UK Waders, explaining why there are now eleven shorebird species on the UK Red List. Its publication coincides with the appearance of the BTO book Into the Red which highlights the problems being faced by seventy species that breed and/or spend the winter in the United Kingdom. The work of seventy writers and seventy artists has been curated by Kit Jewitt (@YOLOBirder on Twitter) and Mike Toms (BTO), and the book is being sold to support the work of both the BTO and the Rare Breeding Birds Panel.

What’s a Red List?

The UK Red List is made up of a strange mixture of common and rare species. Nobody will be surprised to see fast-disappearing Turtle Dove and Willow Tit, but why are 5.3 million pairs of House Sparrow (right) in the same company?

The list is very important because it helps to set the agenda for conservation action, influences the way that money for research is distributed and focuses attention during planning decisions. The main criteria for inclusion are population size – hence the inclusion of species that are just hanging on in the UK, such as Turtle Dove – and the speed of decline of common species. Data collected by volunteers, working under the auspices of the British Trust for Ornithology (BTO), measured a population decline for House Sparrow of 69% between 1977 and 2018, which is worrying enough to earn this third most numerous breeding species in the UK a place in Into the Red.

Mark Eaton of the Rare Breeding Birds Panel explains how listing works.

The Birds of Conservation Concern (BOCC) system, through which the Red List and Amber Lists are determined, uses a strict set of quantitative criteria to examine the status of all of the UK’s ‘regularly’ occurring species (scarce migrants and vagrants aren’t considered), and uses a simple traffic light system to classify them. There are ‘Red’ criteria with thresholds for rates of decline in numbers and range, historical decline and international threat (if a species is considered globally threatened it is automatically Red-listed in the UK), together with a range of other considerations such as rarity, the international importance of UK populations, and how localised a species is. If a species meets any of the Red List criteria it goes onto the Red List.

This blog is about the eleven waders in Into the Red, but there are 59 other fascinating species accounts and wonderful artworks. Each of the species accounts below starts with a quote from the book and is accompanied by a low-resolution version of the artwork.

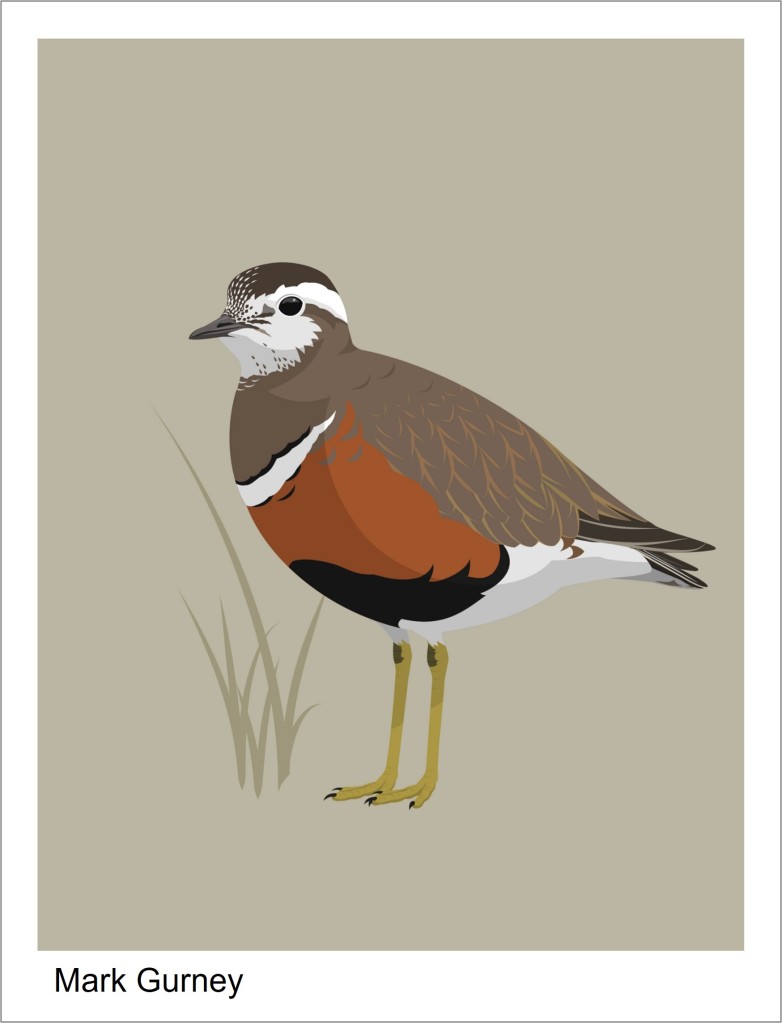
Dotterel

“Dot, dot, dot, Dotterel. Disappearing – a dash, dashing off the page.” – Alicia Hayden

The UK’s small population of Dotterel is restricted to the high tops of Scottish mountains, with only occasional breeding reports elsewhere. Three decades ago, the warning bells were raised, as warming conditions and an elevated snowline turned the Dotterel into a poster bird for climate change campaigners. The detailed reasons for the species’ decline may still need to be nailed down but candidate causes, such as declining insect food supplies and the increasing numbers of generalist predators, are probably all linked to a changing climate – squeezing Dotterel into a smaller area of the mountain plateaux of Scotland.

There’s a blog about the decline in Dotterel numbers called UK Dotterel numbers have fallen by 57%, based upon a paper that uses data up until 2011. At this point, the population was estimated at between 280 and 645 pairs. There has been no suggestion of improvement since that blog was written. Interestingly, Dotterel may have a way out of their predicament, as we know that marked individuals move between Scotland and Norway in the same breeding season. See also Scotland’s Dotterel: still hanging on, which highlights the pressures that youngsters face in North Africa, during the first eighteen months of their lives.

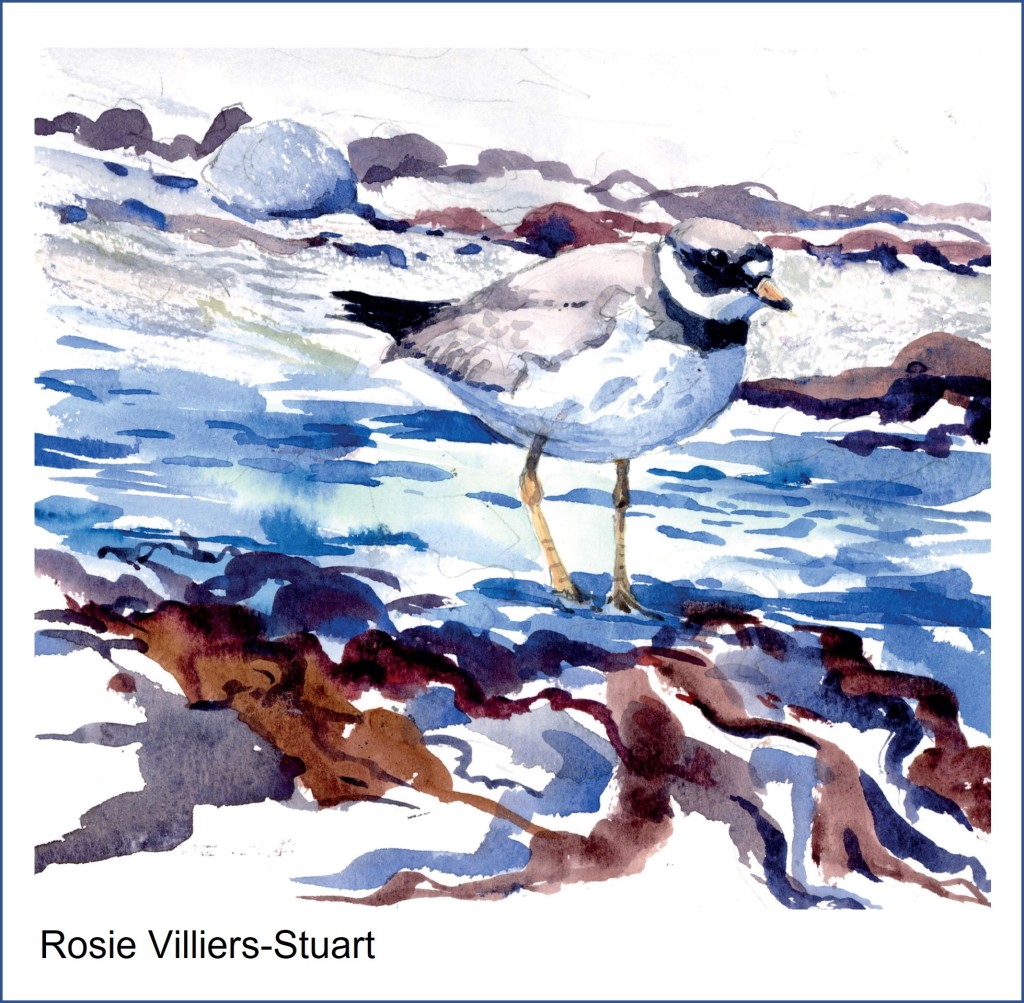
Ringed Plover

“The gentle scuttle over the rocks, the unmistakable bum-bob and the elegant glide into a nest site– Dan Rouse

One of the criteria that the BOCC panel takes into account, when constructing the Red List, is the responsibility the UK has for a species or subspecies in the breeding season, during winter or both. The Ringed Plovers we see in the UK in the winter are almost exclusively of the hiaticula subspecies; birds that breed in southern Scandinavia, around the Baltic, in western Europe and in the UK. There are only estimated to be 73,000 individuals in this subspecies, so the 42,500 that winter in the UK constitute a large percentage of the Ringed Plovers that breed in many of these countries.

The Wetland Bird Survey graph shows a decline of over 50% between 1989 and 2014. At the start of the period, Ringed Plover numbers were at an all-time high but this is still a dramatic and consistent drop. Numbers on the open coast did not drop as much (see Waders on the coast) and those on estuaries may have stabilised or even have increased slightly, since 2014, but Ringed Plovers need some good breeding years. Disturbance is an issue for nesting Ringed Plovers, which share their beaches with visitors and dogs, as discussed in this blog about the ‘no go’ areas along the Norfolk and Suffolk coasts – On the beach. Winter disturbance can be a problem for waders too (see Disturbed Turnstones).

Lapwing

“I heard them before I saw them. Like the plaintive squeak of a rubber toy, or an oboist tuning up …” – Tessa Boase

The Lapwing used to nest across the whole of the United Kingdom and was a common bird in almost every village. It’s still the most numerous breeding wader in the UK, with 97,500 pairs (APEP4), beating Oystercatcher by just 2,000 pairs. Numbers dropped by 55% between 1967 and 2018, according to BirdTrends 2020, published by BTO & JNCC. Huge losses had already occurred over the previous two centuries, as land was drained and vast numbers of eggs were collected for the table. The Lapwing is now a bird associated with lowland wet grasslands and the uplands, rather than general farmland.

Red-listing has been important for Lapwing, increasing the profile of the species and encouraging the development of specific agri-environment schemes targeted at species recovery. These include ‘Lapwing plots’ in arable fields and funding to raise the summer water tables in lowland grassland. Several WaderTales blogs describe efforts to try to increase the number of breeding waders in wet grassland, especially Toolkit for Wader Conservation. The loss of waders, and Lapwings in particular, from general farmland is exemplified in 25 years of wader declines. There are many predators that line up to take Lapwing eggs so it pays to nest in loose ‘colonies’, so that guard duties can be shared.

Whimbrel

“Whimbrel have been doing this journey, between tundra and heath of northern Europe to mudflats and mangroves of Africa, for at least 1.9 million years – Rosie Ellis

Most British and Irish birdwatchers think of Whimbrel as spring migrants, enjoying seeing flocks of Icelandic birds when they pause on their way north from West Africa (see Iceland to Africa non-stop). There is a small, vulnerable UK population nesting almost exclusively on Shetland. The latest estimate is 290 pairs (2009), down from an estimate of 530 pairs, published in 1997. We await the results of a 2021 survey with interest. Many pairs have been lost from Unst and Fetlar and this blog about habitat requirements might give clues as to why: Establishing breeding requirements of Whimbrel.

The curlew family is in trouble across the Globe, potentially because these big birds need so much space (see Why are we losing our large waders?). Hints of future issues for Eurasian Whimbrel are coming from Iceland, where forestry is squeezing them out of some key areas: Iceland’s waders need a strategic forestry plan.

Curlew

“A song that seems to split in mid-air and take the heart in two directions at once – David Gray

What more can be said about Curlew, ‘promoted’ to the red list in 2015 and designated as ‘near threatened’ globally. Most significant is the story from Ireland, where 94% of breeding birds disappeared in just 30 years. These blogs provide more information about the decline and review some of the reasons.

Across every part of the UK, stakeholder groups have come together to support populations of breeding Curlew, using a mixture of habitat management, predator reduction and nest protection measures. One recent innovation is to raise chicks in captivity, in an attempt to boost local populations in England. There’s more in Will head-starting work for Curlew?

Black-tailed Godwit

“These birds become old friends and open our eyes to the world of migration – Jennifer Gill

Winter Black-tailed Godwit numbers are booming but these are islandica – birds that have benefited from warmer spring and summer conditions in Iceland, as you can read here in: From local warming to range expansion. Their limosa cousins are in trouble in their Dutch heartlands (with declines of 75%) and there have been similar pressures on the tiny remaining breeding populations in the Ouse and Nene Washes, as you can discover in England’s Black-tailed Godwits. A head-starting project in the Washes is boosting the number of chicks; so much so that released birds now make up more than a quarter of this fragile population. Red-listing has shone a spotlight on this threatened subspecies, attracting the funding needed for intensive conservation action.

Ruff

“But then, good grief, in May and June, I’m treated to a different plume; A glorious crown, I gush and swoon – and then, no doubt, I change my tune. – Jess French

Some Ruff spend the winter months in the UK and numbers are boosted in spring as birds pass through on their way from Africa to Scandinavia and the Baltic countries. Occasionally, males in glorious breeding attire will display in leks, perhaps attracting the attention of females. As a (very) scarce breeder, Ruff automatically earns a place on the Red List.

250 years ago, Ruff were breeding between Northumberland and Essex, before our ancestors learnt how to drain wetlands and define a hard border between the North Sea and farmland. Hat-makers, taxidermists and egg-collectors added to the species’ woes and, by 1900, breeding had ceased. The 1960s saw a recolonisation and breeding Ruff are still hanging on. Lekking males cause excitement in sites as disparate as Lancashire, Cambridgeshire and Orkney, and there are occasional nesting attempts. Habitat developments designed to help other wader species may support Ruff but the situation in The Netherlands does not suggest much of a future. Here, a once-common breeding species has declined to an estimated population of 15 to 30 pairs (Meadow birds in The Netherlands).

Dunlin

“Memories of sunny days, swirling flocks of waders and blisters from closing metal rings still linger. How can a bird that was so numerous less than 50 years ago now be Red-listed?” – Graham Appleton

There are good reasons for the addition of Dunlin to the UK Red List; breeding numbers of the schinzii race have declined significantly and the number of wintering alpina Dunlin in Great Britain dropped 10,000 between two periods that were only eight years apart, as you can read in this blog about population estimates for waders.

The fall in breeding numbers is probably the bigger problem, as indicated by range reductions in successive breeding atlas periods (1968-72, 1988-91 and 2008-11). It’s hard to monitor what is happening to numbers on a year-by-year basis because the breeding distribution is too patchy and thin to be picked up via the Breeding Bird Survey. Alarm bells are being raised in Ireland, where numbers have dropped to between 20 and 50 pairs (Status of Rare Breeding Birds across the island of Ireland, 2013-2018), and in the Baltic, where numbers have fallen by 80% since the 1980s. There’s a WaderTales blog about Finnish Dunlin.

The winter decline in the UK may or not be an issue, although it has to be considered as part of large-scale moderate losses across the whole of western Europe. There is a theory that, over the years, as winter conditions on the continental side of the North Sea have become less harsh, new generations of juvenile alpina have settled in countries such as the Netherlands, instead of continuing their southwesterly migrations from northern Russia. Once a wintering site has been chosen, individuals are site faithful, so one ends up with newer generations on the continent and ageing adults in the UK and Ireland. WeBS counts for Dunlin are half what they were 25 years ago.

Purple Sandpiper

“It’s an easy species to overlook, the Purple Sandpiper. For a start, they’re not purple” – Mark Eaton

Purple Sandpiper earns its red listing because a very small number of pairs nest in Scotland. Proof of successful breeding is rare and the species may drop off the list at the next review, as Temminck’s Stint did in 2015. Extirpated species (birds that no longer breed) are not red-listed.

In winter, the rocky coasts of the UK are home to Purple Sandpipers from the Arctic, with a suggestion that North Sea coasts, south of Aberdeen, mainly play host to birds from Spitsbergen and northern Scandinavia, with Greenlandic and Canadian birds more likely to be found further north and on the Atlantic coast. Coastal numbers declined by 19% between 1997/98 and 2015/16, according to the Non-estuarine Waterbird Survey, and WeBS counts suggest numbers have at least halved over a period of 25 years. The Highland Ringing Group has shown that the number of young Purple Sandpipers has been declining on the Moray Firth, suggesting several years with relatively poor breeding success, for birds migrating from the northwest, or short-stopping by new generations of youngsters, as discussed for Dunlin. Perhaps they are wintering in Iceland these days?

Woodcock

“Like clockwork, I’d encounter this sight at 7 pm each summer evening as one flew over my head in the back garden, heading towards the thick woodland. – Megan McCubbin

The presence of Woodcock on the Red List causes heated debate; how can this still be a game species? Red-listing is indisputable; the most recent survey by BTO & GWCT showed that there was a decline in roding males from 78,000 in 2003 to 55,000 in 2013, with the species being lost from yet more areas of the UK. Each autumn, the number of Woodcock in the UK rises massively, with an influx of up to 1.4 million birds. Annual numbers depend upon seasonal productivity and conditions on the other side of the North Sea. A recent report on breeding wader numbers in Norway, Sweden and Finland, shows that breeding populations of Woodcock in this area are not declining (Fennoscandian wader factory).

The UK’s breeding Woodcock population is under severe threat from things such as increased deer browsing and drier ground conditions but winter numbers appear to be stable. The difference in conservation status between breeding and wintering populations is reflected in the fact that Woodcock is on both the Red List and the Quarry List, for now. There is a WaderTales blog (Conserving British-breeding Woodcock) that discusses ways to minimizes hunting effects on British birds. These guidelines from GWCT emphasise the importance of reducing pressures on British birds.

Red-necked Phalarope

“The evening light was beautiful, and it was just amazing to watch it spinning around in characteristic fashion” – Dawn Balmer

Red-necked Phalaropes that breed in Shetland and a few other parts of northern Scotland appear to be an overflow from the Icelandic population; birds which migrate southwest to North America and on to the Pacific coastal waters of South America. This BOU blog describes the first track revealed using a geolocator.

The Red-necked Phalarope was never a common breeder and came under pressure from egg-collectors in the 19th Century. Numbers are thought to have recovered to reach about 100 pairs in Britain & Ireland by 1920. Numbers then fell to about 20 pairs by 1990, so the latest estimate of 108 pairs in 2018 reflects conservation success (The Rare Breeding Birds Panel). Given the restricted breeding range and historical declines, it is unlikely that the next review will change the conservation status from Red to Amber, despite the recovery of numbers.

In conclusion

The Red List creates some strange bedfellows. In the book, Turtle Dove follows Herring Gull (right); a bird with links to love and romance and another with at best the charm of a roguish pirate. But the List works; it creates an evidence-base that help those who devise agricultural subsidy systems, advise on planning applications, license bird control and prioritise conservation initiatives.

Into the Red aims to raise awareness of the UK’s most at-risk bird species, eleven of which are waders, and to raise money to support the Rare Breeding Birds Panel and BTO research scientists. This is a follow-up to Red67, published in 2019 and based on the Red List from 2015. It is sad that this version covers 70 species, rather than 67. Worryingly, the first Red List, produced in 1990, only had 36 species on it.

Into the Red is a lovely book that captures the thoughts and images of a generation. Details of how you can order a copy from the BTO can be found here.


WaderTales blogs are written by Graham Appleton (@GrahamFAppleton) to celebrate waders and wader research. Many of the articles are based on published papers, with the aim of making shorebird science available to a broader audience.